amCharts 5: MapsJavaScript map library
Interactive, stunning maps for your data, with hundreds of bundled GeoJSON maps, multiple projections and full interactivity. No tile server, no API key, no per-load fees.
Maps that work everywhere.
Hundreds of Maps
The world, continents, almost every country, US states and counties, and the 120th Congress districts, in high and low detail. Or bring your own GeoJSON.
Projections and Globes
Mercator, Natural Earth, Equal Earth and Albers USA, or a globe you turn by touch or mouse, with animated changes from one to another.
Heat Maps
Color regions by your data with heat rules: a smooth gradient, or a scale through several colors, with a heat legend.
Pixel Maps
Draw any map as dots, squares, diamonds or hexagons, or raise them into 3D columns, with heat rules and tooltips as usual.
Satellite Imagery
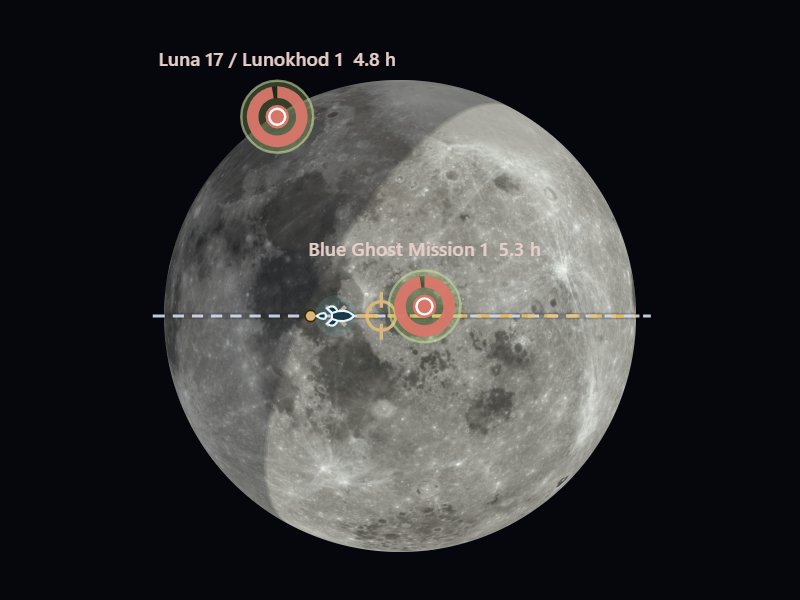
Wrap a satellite picture around the globe and it turns with the map: the Earth by day or at night, the Moon, Mars and more.
Day and Night
Shade the side of the Earth where it is night, with twilight and the sun, for right now or any moment you choose.
Routes, Arcs and Flows
Lines between places, raised into arcs if you like, with planes or pins moving along them, or flows drawn as Sankey bands.
Markers and Clusters
Pins, bubbles and pictures that stand up or lie flat on the surface, grouped into clusters until you zoom in.
Zoom and Drill-Down
Click a country to zoom to it, draw a box or double-click to zoom in, and drill down from continents to countries to regions.
Color-code the world by your data.
Apply heat rules to any map polygon series. Data values automatically map to color gradients — from subtle tints to bold saturations. Toggle between datasets, switch projections, and let your users explore.
This map visualizes tariff data across 180+ countries. Hover for values, toggle between Mercator and globe projections, or switch datasets with the built-in controls. All interactive, all real-time.
Hundreds of markers. Zero clutter.
Drop 500 markers on a map — amCharts automatically clusters them into groups. Zoom in and clusters break apart. Click a cluster to zoom. Smooth, smart, and instant.
161 world capitals, automatically clustered by proximity. Zoom in to see individual cities. Click any cluster to zoom to its bounds. All handled by ClusteredPointSeries.
The Earth from space. Or the Moon.
Wrap a satellite picture around the globe, and the map redraws it as you turn and zoom. Borders, markers and routes go on top as on any map, and with a night picture and the sun's position it shows day and night as they are right now.
NASA's pictures of the Earth by day and at night, the Moon, Mars, Venus, Jupiter, Io and Ganymede are ready to use, from the amCharts CDN or the geodata package. Pick one above the globe, or drag to turn it.
Built with amCharts Maps.
Interactive tools and experiments from the DataViz Dojo — all powered by amCharts 5 Maps.


Jumpstart your map
with zero code.
Choropleth, bubble, pin, connection and flow maps — all ready-made templates in Chart Maker. Load your data, style it point-and-click, then export the config for your code or publish it as is with amCharts Pro.
Need a map file instead? Make one in the SVG Map Generator or the Pixel Map Generator, or download one of the 427 ready-made SVG maps.

AI handles the complexity.
You keep the control.
amCharts has always been powerful. Now AI eliminates the learning curve. Describe what you want — AI writes correct amCharts code.
Need something custom? We'll build it.
Custom map visualizations, GeoJSON processing, complex spatial dashboards — from the team that wrote amCharts. Talk to our team
