


 本文总结了Python数据分析与可视化的课程内容,重点关注图像的数组表示和变换。图像以RGB矩阵形式存储,通过PIL和numpy处理。数组变换涉及图像的读取、修改和保存,实现图像形状的改变。此外,介绍了如何创造手绘风格图像,这种风格的特点包括黑白灰调、重边界和光源效果,是通过灰度化和梯度调整实现的。
本文的主要内容是基于中国大学mooc(慕课)中的“Python数据分析与可视化”课程进行整理和总结。
图像的数组表示
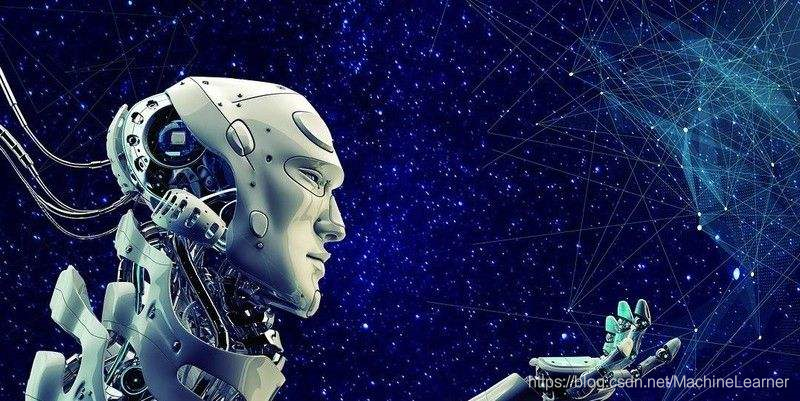
图像一般采用RGB色彩模式,图像中的每一个像素点,由红色,绿色和蓝色组成,这三种颜色形成三个颜色通道,每个通道之间进行变化和叠加之后形成各种颜色,其中R,G,B三个颜色通道取值范围均为0-255 ,叠加起来的色彩空间为256^3,RGB形成的颜色包括了人类视力所能感知的所有颜色。所以在计算机的使用中,一般的图像均使用RGB色彩。
在计算机中,图像是一个由像素组成的矩阵,每个元素是一个RGB值,我们可以借助python中的PIL表示图像,使用numpy中的矩阵表示图像中的每一个元素。

from PIL import Image
import numpy as np
im = np.array(Image.open("C:/Users/ABC/introduction to ML with python/AI.jpg"))
print(im.shape,im.dtype)
(401, 800, 3) uint8
可以看到一个图像最终是由三维数据表示,维度分别是高度,宽度和像素RGB值,在第三维度上有三个元素,RGB分别由一个uint8类型表示(uint8取值范围为0-255)。
图像的数组变换
图像的变换:图像可以表示维数组,数组可以运算,经过运算后的数组,可以改变图像的形状,对图像进行变换。
变换步骤:
读入图像,变成数组,形成像素的RGB值的数组表示,修改之后保存成新的图像文件,完成图像的变换。
from PIL import Image
import numpy as np
im = np.array(Image.open("C:/Users/ABC/introduction to ML with python/AI.jpg"))
print(im.shape,im.dtype)
(401, 800, 3) uint8
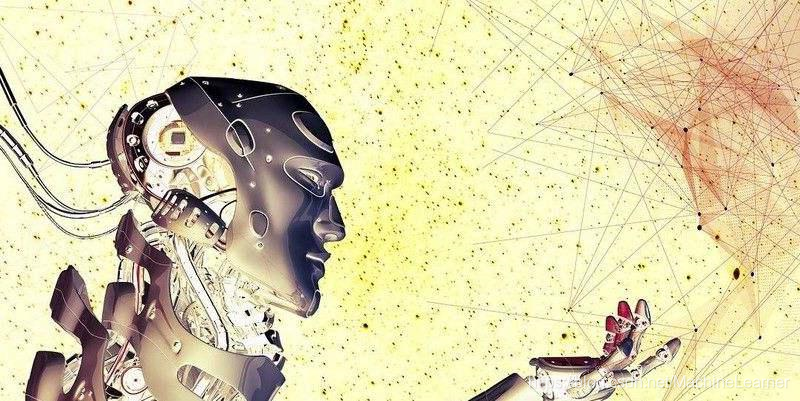
complementary = [255,255,255] - im # 计算图片的每一个像素的补值
new_im = Image.fromarray(complementary.astype('uint8'))
new_im.save("C:/Users/ABC/introduction to ML with python/newAI.jpg")
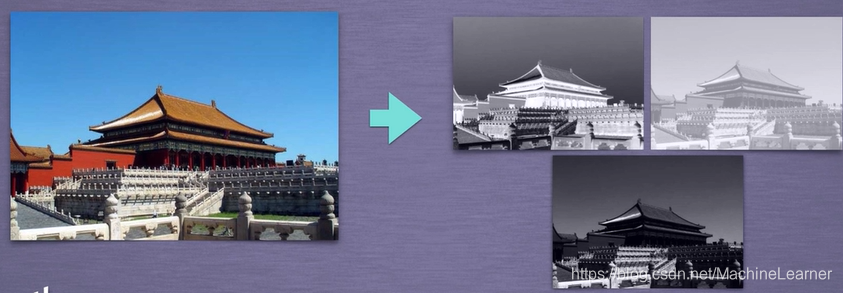
在进行如下图像变换。
a = np.array(Image.open("C:/Users/ABC/introduction to ML with python/AI.jpg").convert('L'))#将彩色图片变成灰度图片,变成二维数组
print(a.shape,a.dtype)
(401, 800) uint8
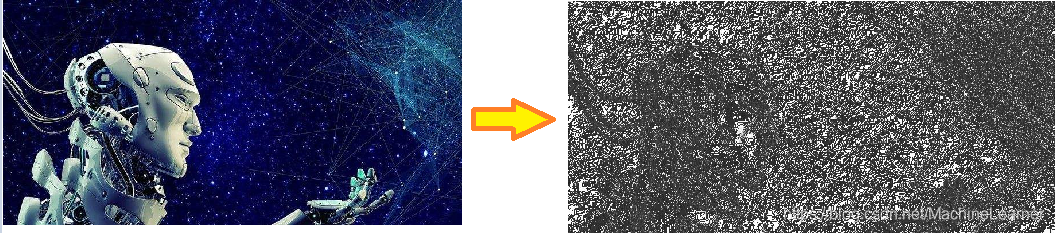
b = 255 - a
new_im = Image.fromarray(b.astype('uint8'))
new_im.save("C:/Users/ABC/introduction to ML with python/b.jpg")
得到如下结果
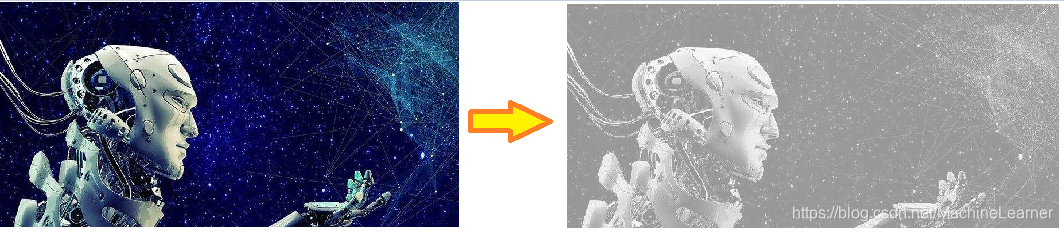
c = 100 / 255 * a + 150
new_im = Image.fromarray(c.astype('uint8'))
new_im.save("C:/Users/ABC/introduction to ML with python/c.jpg")
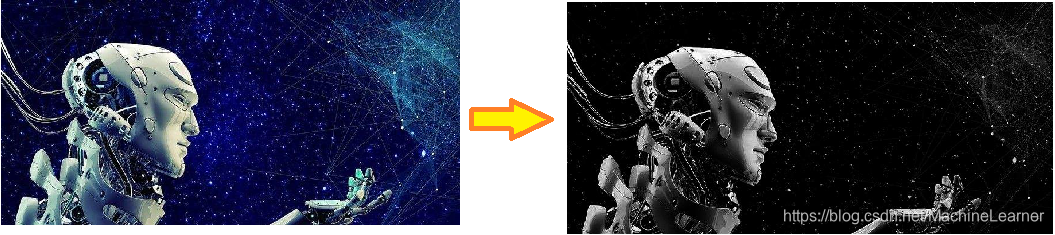
d = 255 * (a / 255) ** 2
new_im = Image.fromarray(d.astype('uint8'))
new_im.save("C:/Users/ABC/introduction to ML with python/d.jpg")
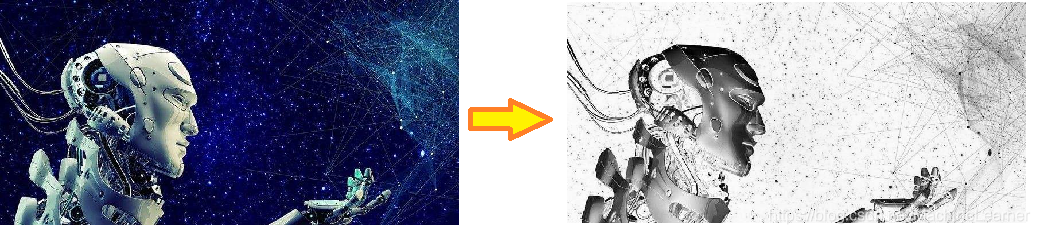
图像的手绘效果
手绘风格图片具有以下特征。
- 黑白灰色
- 边界线条较重
- 相同或相近色彩趋于白色
- 略有光源效果
事实上,手绘风格是在图像进行灰度化的基础上,由立体效果和明暗效果叠加而成,灰度实际上就代表了图像的明暗变化,而梯度值表示的是灰度的变化率,所以可以通过调整像素的梯度值来间接改变图片的明暗程度,立体效果通过虚拟深度值来实现。
a = np.array(Image.open("C:/Users/ABC/introduction to ML with python/AI.jpg").convert('L'))#将彩色图片变成灰度图片,变成二维数组
depth = 10.
grad = np.gradient(a)
grad_x,grad_y = grad
grad_x = grad_x * depth / 100
grad_y = grad_y * depth / 100
A = np.sqrt(grad_x ** 2 + grad_y ** 2 + 1.)
uni_x = grad_x / A
uni_y = grad_y / A
uni_z = 1. / A

vec_el = np.pi / 2.2
vec_az = np.pi / 4.
dx = np.cos(vec_el) * np.cos(vec_az)
dy = np.cos(vec_el) * np.sin(vec_az)
dz = np.sin(vec_el)

b = 255*(dx*uni_x + dy*uni_y+dz*uni_z)
b = b.clip(0,255)

new_im = Image.fromarray(b.astype('uint8'))
new_im.save("C:/Users/ABC/introduction to ML with python/e.jpg")


 1515
1515

 被折叠的 条评论
为什么被折叠?
被折叠的 条评论
为什么被折叠?
 到【灌水乐园】发言


