


 本文介绍了一种使用MATLAB进行三维布朗运动模拟的方法。通过生成随机数并利用累积求和实现一维和三维标准布朗运动轨迹的绘制。一维部分展示了时间序列的变化趋势,三维部分则通过散点图展现了空间中粒子的随机游走过程。
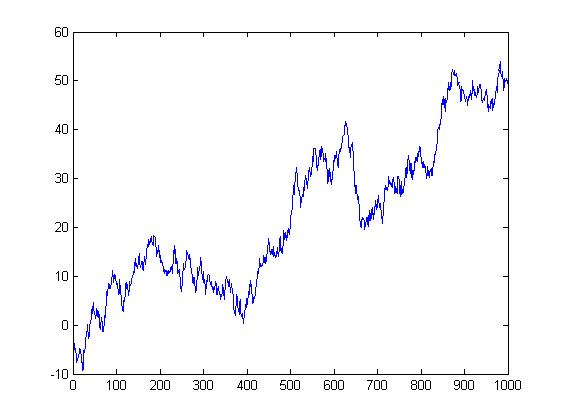
n=1000;
dt=1;
y=[0 cumsum(dt^0.5.*randn(1,n))]; % standard Brownian motion
plot(0:n,y);
三维
npoints = 5000;
dt = 1;
bm = cumsum([zeros(1, 3); dt^0.5*randn(npoints-1, 3)]);
figure(1);
plot3(bm(:, 1), bm(:, 2), bm(:, 3), 'k');
pcol = (bm-repmat(min(bm), npoints, 1))./ ...
repmat(max(bm)-min(bm), npoints, 1);
hold on;
scatter3(bm(:, 1), bm(:, 2), bm(:, 3), ...
10, pcol, 'filled');
grid on;
hold off;


 1375
1375

 被折叠的 条评论
为什么被折叠?
被折叠的 条评论
为什么被折叠?
 到【灌水乐园】发言


