


 本文通过Python的scikit-opt工具箱,利用遗传算法求解旅行商问题(TSP)。首先介绍了TSP问题背景及31个城市坐标,接着详细阐述了如何使用scikit-opt中的遗传算法进行求解,包括安装工具箱、定义问题、调用算法和绘制最优路径图。最后展示了求解结果和源代码,为读者提供了完整的实现流程。

【建模算法】Python调用scikit-opt工具箱中的遗传算法求解TSP问题
TSP (traveling salesman problem,旅行商问题)是典型的NP完全问题,即其最坏情况下的时间复杂度随着问题规模的增大按指数方式增长,到目前为止还未找到一个多项式时间的有效算法。本文探讨了Python调用scikit-opt工具箱中的遗传算法求解TSP问题。
一、问题描述
本案例以31个城市为例,假定31个城市的位置坐标如表1所列。寻找出一条最短的遍历31个城市的路径。
| 城市编号 | X坐标 | Y坐标 | 城市编号 | X坐标 | Y坐标 |
|---|---|---|---|---|---|
| 1 | 1.304 | 2.312 | 17 | 3.918 | 2.179 |
| 2 | 3.639 | 1.315 | 18 | 4.061 | 2.37 |
| 3 | 4.177 | 2.244 | 19 | 3.78 | 2.212 |
| 4 | 3.712 | 1.399 | 20 | 3.676 | 2.578 |
| 5 | 3.488 | 1.535 | 21 | 4.029 | 2.838 |
| 6 | 3.326 | 1.556 | 22 | 4.263 | 2.931 |
| 7 | 3.238 | 1.229 | 23 | 3.429 | 1.908 |
| 8 | 4.196 | 1.044 | 24 | 3.507 | 2.376 |
| 9 | 4.312 | 0.79 | 25 | 3.394 | 2.643 |
| 10 | 4.386 | 0.57 | 26 | 3.439 | 3.201 |
| 11 | 3.007 | 1.97 | 27 | 2.935 | 3.24 |
| 12 | 2.562 | 1.756 | 28 | 3.14 | 3.55 |
| 13 | 2.788 | 1.491 | 29 | 2.545 | 2.357 |
| 14 | 2.381 | 1.676 | 30 | 2.778 | 2.826 |
| 15 | 1.332 | 0.695 | 31 | 2.37 | 2.975 |
| 16 | 3.715 | 1.678 |
二、scikit-opt工具箱简介
scikit-opt工具箱是一个封装了7种启发式算法的 Python 代码库,包含差分进化算法、遗传算法、粒子群算法、模拟退火算法、蚁群算法、鱼群算法、免疫优化算法。官网链接:https://scikit-opt.github.io/scikit-opt/#/zh/
三、调用scikit-opt工具箱中遗传算法求解TSP问题的步骤
1.安装工具箱
pip install scikit-opt
2.编写自定义问题
主要是将自己问题的数据输入到封装的代码中,操作简单,修改码量很少
其中只有两行代码需要修改
num_points = 30                #num_points指需要遍历的节点个数
points_coordinate = np.random.rand(num_points, 2)    #points_coordinate是自定义问题中的节点坐标信息
3.调用遗传算法进行求解
其中的best_points表示最短距离的num_points点的序列(即points_coordinate矩阵中第几个点,但没有回到起点)
from sko.GA import GA_TSP

ga_tsp = GA_TSP(func=cal_total_distance, n_dim=num_points, size_pop=50, max_iter=500, prob_mut=1)
best_points, best_distance = ga_tsp.run()
4.绘制近似最优路径图像
其中的best_points_ 表示从起点出发并回到起点的路径。
(其实与best_points差别就是在best_points后加入起点(best_points的第一个点))
fig, ax = plt.subplots(1, 2)
best_points_ = np.concatenate([best_points, [best_points[0]]])
best_points_coordinate = points_coordinate[best_points_, :]
ax[0].plot(best_points_coordinate[:, 0], best_points_coordinate[:, 1], 'o-r')
ax[1].plot(ga_tsp.generation_best_Y)
plt.show()
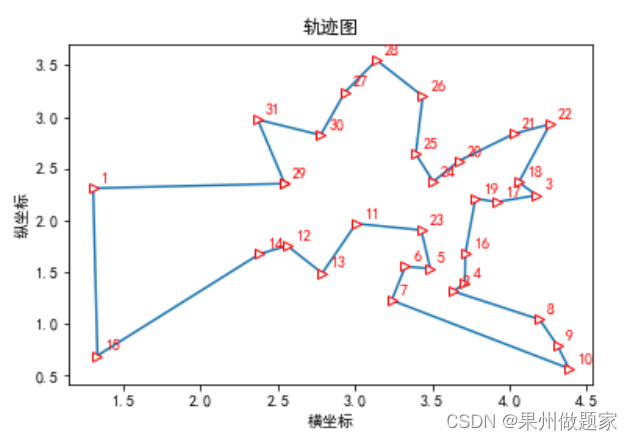
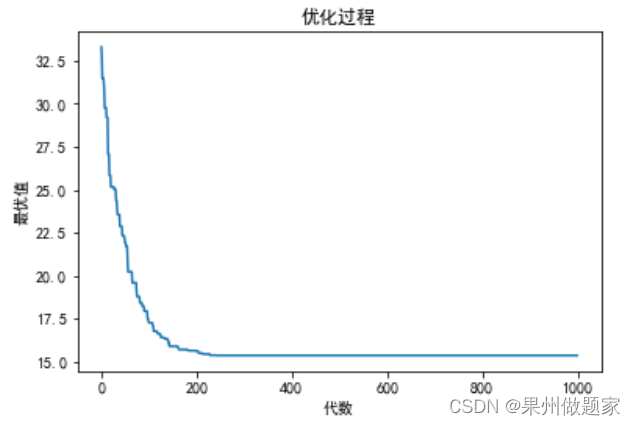
四、求解结果
城市序列与距离:

TSP图和Loss图:
五、完整源代码
python源码:
#遗传算法求解31座城市的TSP问题完整代码:
import numpy as np
from scipy import spatial
import matplotlib.pyplot as plt
from sko.GA import GA_TSP
from time import perf_counter

def cal_total_distance(routine):
    '''计算总距离:输入路线,返回总距离.
    cal_total_distance(np.arange(num_points))
    '''
    num_points, = routine.shape
    return sum([distance_matrix[routine[i % num_points], routine[(i + 1) % num_points]] for i in range(num_points)])

def print_route(best_points):
    result_cur_best=[]
    for i in best_points:
        result_cur_best+=[i]
    for i in range(len(result_cur_best)):
        result_cur_best[i] += 1
    result_path = result_cur_best
    result_path.append(result_path[0])
    return result_path

if __name__=="__main__":
    file_name = 'data.csv'    #31座城市坐标数据文件
    points_coordinate = np.loadtxt(file_name, delimiter=',')
    num_points = points_coordinate.shape[0]
    distance_matrix = spatial.distance.cdist(points_coordinate, points_coordinate, metric='euclidean')

    start=perf_counter()       #计时开始
    # 执行遗传(GA)算法
    ga_tsp = GA_TSP(func=cal_total_distance, n_dim=num_points, size_pop=300, max_iter=1000, prob_mut=1)   #调用工具箱

     # 结果输出
    best_points, best_distance = ga_tsp.run()
    print("运行时间是: {:.5f}s".format(perf_counter()-start))   #计时结束
    print("最优路线:", print_route(best_points))
    print("最优值:", best_distance[0])

    best_points_ = np.concatenate([best_points, [best_points[0]]])
    best_points_coordinate = points_coordinate[best_points_, :]

    #绘图
    plt.rcParams['font.sans-serif'] = 'SimHei'  # 设置中文显示
    plt.rcParams['axes.unicode_minus'] = False

    fig1, ax1 = plt.subplots(1, 1)
    ax1.set_title('轨迹图', loc='center')
    line=ax1.plot(best_points_coordinate[:, 0], best_points_coordinate[:, 1], marker='>', mec='r', mfc='w')
    for i in range(num_points):
        plt.text(best_points_coordinate[:, 0][i] + 0.05, best_points_coordinate[:, 1][i] + 0.05, str(best_points[i]+1), color='red')
    ax1.set_xlabel("横坐标")
    ax1.set_ylabel("纵坐标")

    fig2, ax2 = plt.subplots(1, 1)
    ax2.set_title('优化过程', loc='center')
    ax2.plot(ga_tsp.generation_best_Y)
    ax2.set_xlabel("代数")
    ax2.set_ylabel("最优值")
    plt.show()


 1万+
1万+

 被折叠的 条评论
为什么被折叠?
被折叠的 条评论
为什么被折叠?
 到【灌水乐园】发言


