


Prometheus的rule规则
Alertmanager是搭配Prometheus使用的,需要在Prometheus中配置rule告警文件,告警的规则如下
[root@localhost local]# cat prometheus-2.31.1/rules/node_alerts.yml
groups:
- name: 主机状态-监控告警
  rules:
  - alert: 主机状态
    expr: up {job="kubernetes-nodes"} == 0
    for: 15s
    labels:
      status: 非常严重
    annotations:
      summary: "{{.instance}}:服务器宕机"
      description: "{{.instance}}:服务器延时超过15s"

  - alert: CPU使用情况
    expr: 100-(avg(irate(node_cpu_seconds_total{mode="idle"}[5m])) by(instance)* 100) > 60
    for: 1m
    labels:
      status: warning
    annotations:
      summary: "{{$labels.instance}}: High CPU Usage Detected"
      description: "{{$labels.instance}}: CPU usage is {{$value}}, above 60%"

  - alert: NodeFilesystemUsage
    expr: 100 - (node_filesystem_free_bytes{fstype=~"ext4|xfs"} / node_filesystem_size_bytes{fstype=~"ext4|xfs"} * 100) > 80
    for: 1m
    labels:
      severity: warning
    annotations:
      summary: "Instance {{ $labels.instance }} : {{ $labels.mountpoint }} 分区使用率过高"
      description: "{{ $labels.instance }}: {{ $labels.mountpoint }} 分区使用大于80% (当前值: {{ $value }})"

  - alert: 内存使用
    expr: (node_memory_MemTotal_bytes - node_memory_MemAvailable_bytes) / node_memory_MemTotal_bytes * 100 > 80
    for: 1m
    labels:
      status: 严重告警
    annotations:
      summary: "{{ $labels.instance}} 内存使用率过高!"
      description: "{{ $labels.instance }} 内存使用大于80%(目前使用:{{ $value}}%)"


  - alert: IO性能
    expr: (avg(irate(node_disk_io_time_seconds_total[1m])) by(instance)* 100) > 60
    for: 1m
    labels:
      status: 严重告警
    annotations:
      summary: "{{$labels.instance}} 流入磁盘IO使用率过高!"
      description: "{{ $labels.instance }} 流入磁盘IO大于60%(目前使用:{{ $value }})"


  - alert: 网络
    expr: ((sum(rate (node_network_receive_bytes_total{device!~'tap.*|veth.*|br.*|docker.*|virbr*|lo*'}[5m])) by (instance)) / 100) > 102400
    for: 1m
    labels:
      status: 严重告警
    annotations:
      summary: "{{ $labels.instance}} 流入网络带宽过高!"
      description: "{{ $labels.instance }}流入网络带宽持续2分钟高于100M. RX带宽使用率{{ $value }}"
  - alert: TCP会话
    expr: node_netstat_Tcp_CurrEstab > 1000
    for: 1m
    labels:
      status: 严重告警
    annotations:
      summary: "{{ $labels.instance }} TCP_ESTABLISHED过高!"
      description: "{{ $labels.instance }} TCP_ESTABLISHED大于1000%(目前使用:{{ $value }}%)"
Alertmanager的安装配置
- 安装
wget https://github.com/prometheus/alertmanager/releases/download/v0.22.2/alertmanager-0.22.2.linux-amd64.tar.gz
tar -xxvf 解压缩
2. 设置系统启动(centos7)
[root@localhost local]# cat /usr/lib/systemd/system/alertmanager.service

[Unit]
Description=https://prometheus.io

[Service]
Restart=on-failure
ExecStart=/usr/local/alertmanager/alertmanager --config.file=/usr/local/alertmanager/alertmanager.yml --storage.path="/usr/local/alertmanager/data/"   --data.retention=120h

[Install]
WantedBy=multi-user.target
注意自己的解压包地址,创建上述的文件
完成之后systemctl daemon-reload
systemctl enable alertmanager
systemctl start alertmanager
- alertmanager的配置文件
在alertmanager文件夹下的alertmanager.yml
global:
  resolve_timeout: 5m
  wechat_api_url: 'https://qyapi.weixin.qq.com/cgi-bin/'
templates:     #告警模板
  - './template/wechat.tmpl'

route:  # 设置报警分发策略
  group_by: ['alertname'] # 分组标签
  group_wait: 10s      # 告警等待时间。告警产生后等待10s,如果有同组告警一起发出
  group_interval: 10s  # 两组告警的间隔时间
  repeat_interval: 1m  # 重复告警的间隔时间,减少相同右键的发送频率 此处为测试设置为1分钟
  receiver: 'wechat'  # 默认接收者

receivers:
  - name: 'wechat'
    wechat_configs:
      - send_resolved: true
        agent_id: ''     # 自建应用的agentId
        to_party: ''  # 接收告警消息的人员Id
        api_secret: '' # 自建应用的secret
        corp_id: ''  # 企业ID
改完上述的配置文件重新加载配置文件
[root@localhost local]# cat alertmanager/reload.sh
curl -XPOST http://localhost:9093/-/reload
- 然后登陆localhost:9093查看,是否有告警
如下图
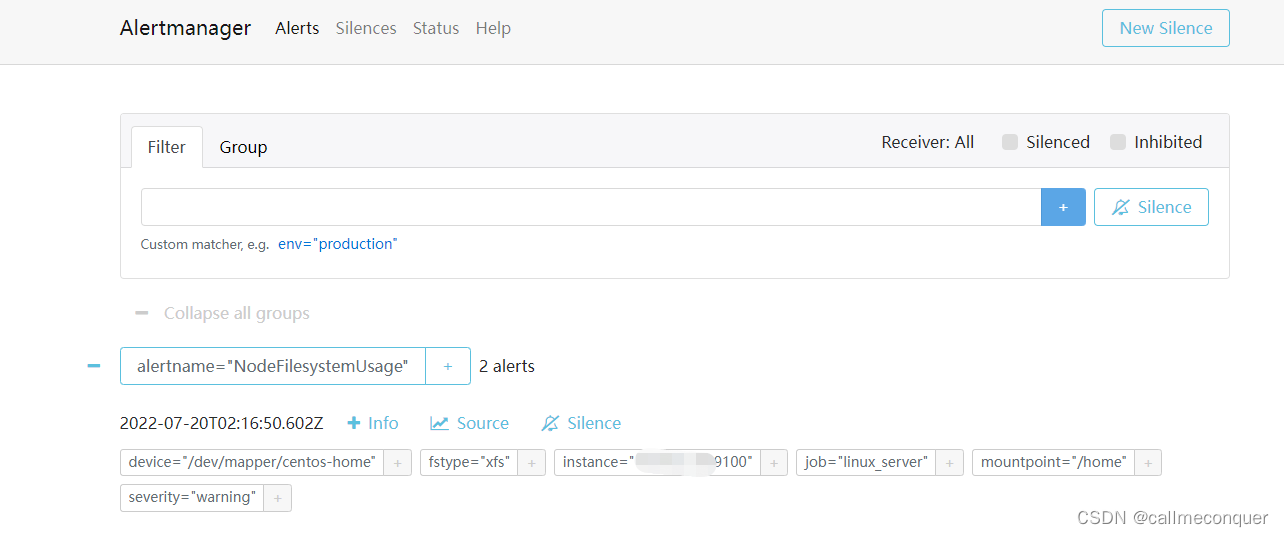
查看配置的告警信息是否有显示,如果没有显示自行去翻看哪里配置错误了。
查看alertmanager的配置文件命令
[root@localhost alertmanager]# ./amtool check-config alertmanager.yml
Checking 'alertmanager.yml'  SUCCESS
Found:
 - global config
 - route
 - 0 inhibit rules
 - 1 receivers
 - 1 templates
  SUCCESS
-
然后神奇的一幕来了,无论怎么调整企业微信都没有消息显示。。。。
这就让我用尽了各种方法都查不出来原因,还给各个大佬留言询问,也没有结果,直到我想到了用Python脚本测试一下是不是微信那边服务器设置的原因。
毕竟,我这边能ping通微信程序url的域名,以及我这边没有做任何的网络限制。 -
Python脚本测试微信应用发送
脚本内容如下:
[root@localhost local]# cat test.py
#!/usr/bin/env python
#coding=utf_8
#!/root/.virtualenvs/wechat/bin/python
# usage: send message via wechat

import requests, sys, json
import urllib3
urllib3.disable_warnings()


###填写参数###

# Corpid是企业号的标识

Corpid = ""


# Secret是管理组凭证密钥

Secret = ""


# 应用ID

Agentid = ""


# token_config文件放置路径

Token_config = r'/usr/local/test__wechat_config.json'


###下面的代码都不需要动###


def GetTokenFromServer(Corpid, Secret):

    """获取access_token"""

    Url = "https://qyapi.weixin.qq.com/cgi-bin/gettoken"

    Data = {

        "corpid": Corpid,

        "corpsecret": Secret

    }

    r = requests.get(url=Url, params=Data, verify=False)

    print(r.json())

    if r.json()['errcode'] != 0:

        return False

    else:

        Token = r.json()['access_token']

        file = open(Token_config, 'w')

        file.write(r.text)

        file.close()

        return Token


def SendMessage(Partyid, Subject, Content):

    """发送消息"""

    # 获取token信息

    try:

        file = open(Token_config, 'r')

        Token = json.load(file)['access_token']

        file.close()

    except:

        Token = GetTokenFromServer(Corpid, Secret)


    # 发送消息

#    Url = "https://qyapi.weixin.qq.com/cgi-bin/message/send?access_token=%s" % Token
    Url = "https://qyapi.weixin.qq.com/cgi-bin/message/send?access_token=ACCESS_TOKEN"

    Data = {

        "toparty": Partyid,

        "msgtype": "text",

        "agentid": Agentid,

        "text": {"content": Subject + '\n' + Content},

        "safe": "0"

    }

    r = requests.post(url=Url, data=json.dumps(Data), verify=False)


    # 如果发送失败,将重试三次

    n = 1

    while r.json()['errcode'] != 0 and n < 4:

        n = n + 1

        Token = GetTokenFromServer(Corpid, Secret)

        if Token:

            Url = "https://qyapi.weixin.qq.com/cgi-bin/message/send?access_token=%s" % Token

            r = requests.post(url=Url, data=json.dumps(Data), verify=False)

            print(r.json())


    return r.json()


if __name__ == '__main__':

    # 部门id

    Partyid = ''

    # 消息标题

    Subject = '自应用程序代码测试'

    # 消息内容

    Content = 'str(sys.argv[3])'

    Status = SendMessage(Partyid, Subject, Content)

    print(Status)
环境是Python2.7,需要下载工具,按照提示pip下载即可。
下载pip
wget https://bootstrap.pypa.io/pip/2.7/get-pip.py
python2 get-pip.py
然后运行该脚本就会发现,报错了!!!!!
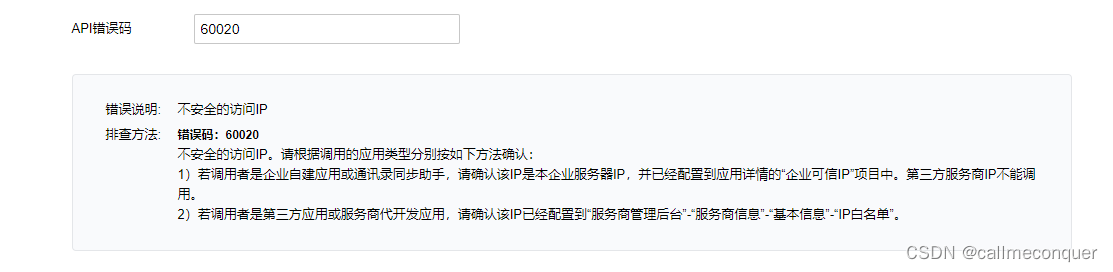
{u’errcode’: 60020, u’errmsg’: u’not allow to access from your iprom ip: x.x.x.x, more info at https://open.work.weixin.qq.com/devtool/query?e=60020’}
搜索报错的代码60020发现,原来是我的IP地址没有加入到服务器接收信息的白名单里面,所以微信端是收不到我的服务器发送的消息的。
而想加入白名单,需要成为企业微信的后台服务商。。。。。
官网:企业微信服务商后台登陆
这这这,尴尬啊,还有就是在企微应用管理界面坐下面的左下角添加IP。
附微信开发者中心的应用参数网页地址:企业微信开发者中心


 7万+
7万+

 被折叠的 条评论
为什么被折叠?
被折叠的 条评论
为什么被折叠?
 到【灌水乐园】发言


