


 本文详细介绍了Prometheus监控系统的安装配置过程,包括Go语言、Prometheus Server及exporters的安装,并演示了如何配置Prometheus.yml来监控多个节点和数据库。此外,还介绍了Grafana的安装和配置,以及如何通过它展示Prometheus收集的数据。
一、Prometheus Server安装
1、安装go
wget -c https://dl.google.com/go/go1.13.5.linux-amd64.tar.gz
tar zxvf go1.13.5.linux-amd64.tar.gz -C /usr/local/
cd /usr/local/sbin
ln -s /usr/local/go/bin/go go
go version
输出:go version go1.13.5 linux/amd64,表示安装成功
2、安装Prometheus
server端和client端都从此地址下载:https://prometheus.io/download/
tar zxvf prometheus-2.15.2.linux-amd64.tar.gz -C /usr/local
ln -s prometheus-2.15.2.linux-amd64 prometheus
cd prometheus
修改配置文件 prometheus.yml
添加DB连接信息
# my global config
global:
  scrape_interval:     15s # Set the scrape interval to every 15 seconds. Default is every 1 minute.
  evaluation_interval: 15s # Evaluate rules every 15 seconds. The default is every 1 minute.
  # scrape_timeout is set to the global default (10s).

# Alertmanager configuration
alerting:
  alertmanagers:
  - static_configs:
    - targets:
      # - alertmanager:9093

# Load rules once and periodically evaluate them according to the global 'evaluation_interval'.
rule_files:
  # - "first_rules.yml"
  # - "second_rules.yml"

# A scrape configuration containing exactly one endpoint to scrape:
# Here it's Prometheus itself.
scrape_configs:
  # The job name is added as a label `job=<job_name>` to any timeseries scraped from this config.
  - job_name: 'prometheus'

    # metrics_path defaults to '/metrics'
    # scheme defaults to 'http'.

    static_configs:
    - targets: ['localhost:9090']

# node1
  - job_name: 'linux_node1'
    static_configs:
    - targets: ['192.168.222.76:9100']
      labels:
        alias: 'node1'

  - job_name: 'mysql_node1'
    static_configs:
    - targets: ['192.168.222.76:9104']
      labels:
        alias: 'node1'

# node2
  - job_name: 'linux_node2'
    static_configs:
    - targets: ['192.168.222.77:9100']
      labels:
        alias: 'node2'

  - job_name: 'mysql_node2'
    static_configs:
    - targets: ['192.168.222.77:9104']
      labels:
        alias: 'node2'

# node3
  - job_name: 'linux_node3'
    static_configs:
    - targets: ['192.168.222.78:9100']
      labels:
        alias: 'node3'

  - job_name: 'mysql_node3'
    static_configs:
    - targets: ['192.168.222.78:9104']
      labels:
        alias: 'node3'
./prometheus --web.enable-lifecycle & 启动
输出以下日志:
level=info ts=2020-01-10T09:22:19.149Z caller=main.go:734 msg="Loading configuration file" filename=prometheus.yml
level=info ts=2020-01-10T09:22:19.152Z caller=main.go:762 msg="Completed loading of configuration file" filename=prometheus.yml
level=info ts=2020-01-10T09:22:19.152Z caller=main.go:617 msg="Server is ready to receive web requests."
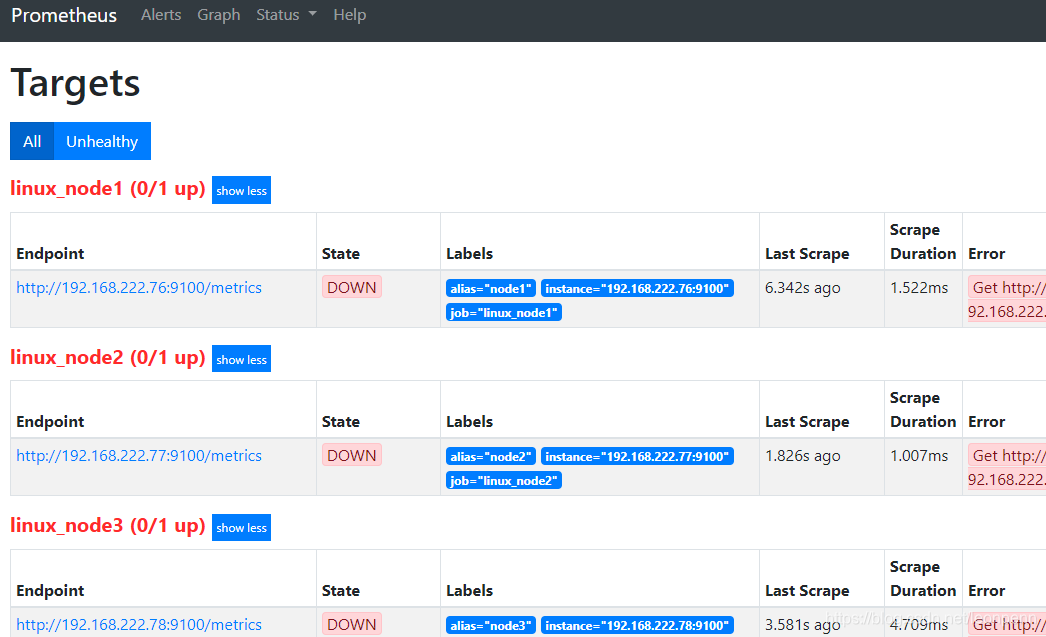
web页面:IP:9090
由于被监控机器上尚未部署Prometheus客户端,导致Target的State均为down
Tip:
1、重载Prometheus配置文件的方法(需要使用 ./prometheus --web.enable-lifecycle & 方式启动):
curl -XPOST http://localhost:9090/-/reload,正常提示如下:
[root@test02 prometheus]# curl -XPOST http://localhost:9090/-/reload
level=info ts=2020-01-13T08:36:45.046Z caller=main.go:734 msg="Loading configuration file" filename=prometheus.yml
level=info ts=2020-01-13T08:36:45.048Z caller=main.go:762 msg="Completed loading of configuration file" filename=prometheus.yml
2、关闭Prometheus的方法:
curl -X POST http://localhost:9090/-/quit
二、Prometheus exporters
1、安装node_exporter
注:被监控端安装,解压 node_exporter-0.18.1.linux-amd64.tar.gz
将 node_exporter 放置到 /usr/local/sbin
启动:node_exporter &
2、数据库授权
GRANT REPLICATION CLIENT, PROCESS ON *.* TO 'prometheus'@'127.0.0.1' identified by '123456';
GRANT SELECT ON performance_schema.* TO 'prometheus'@'127.0.0.1';
3、安装mysqld_exporter
注:被监控端安装
mysqld_exporter-0.12.1.linux-amd64.tar.gz
将 mysqld_exporter 放置到 /usr/local/sbin
配置my.cnf用于存储mysqld_exporter连接数据库所需密码
touch /etc/prometheus_mysqld_exporter.cnf
[client]
user=prometheus
password=123456
启动:mysqld_exporter --config.my-cnf="/etc/prometheus_mysqld_exporter.cnf" &
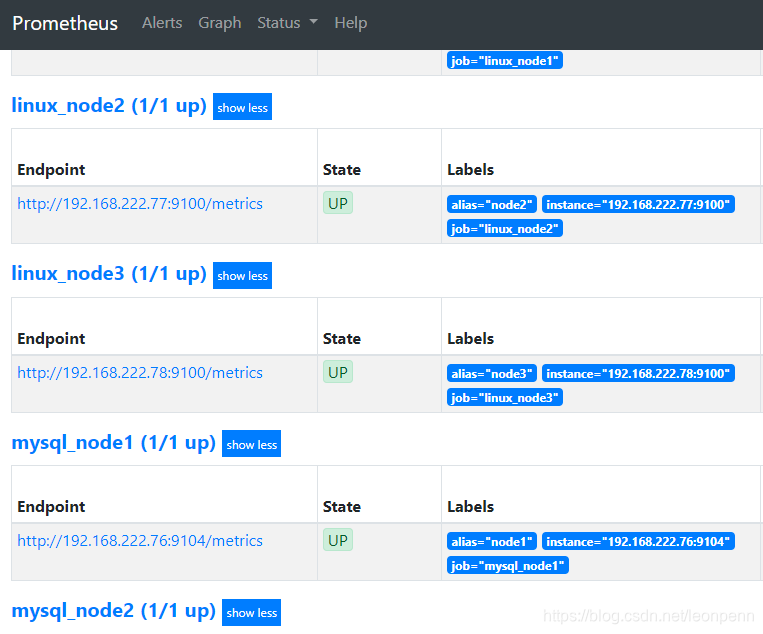
重新打开web页面中,Target的State已转为UP
注意:Prometheus采用时区是GMT,与本地时区不同,后面的Grafana会显示正常时间的。
三、Grafana
1、安装
wget https://dl.grafana.com/oss/release/grafana-6.5.2-1.x86_64.rpm
sudo yum localinstall grafana-6.5.2-1.x86_64.rpm
vim /etc/grafana/grafana.ini,加入如下section,
[dashboards.json]
enabled = true
path = /var/lib/grafana/dashboards
启用percona/grafana-dashboards
cd /var/lib/grafana/
git clone https://github.com/percona/grafana-dashboards.git
cp -r grafana-dashboards/dashboards/ .
rm -rf grafana-dashboards/
画线操作>=5.0版本的grafana已不支持。
2、启动
systemctl start grafana-server
web页面:IP:/3000(admin/admin)
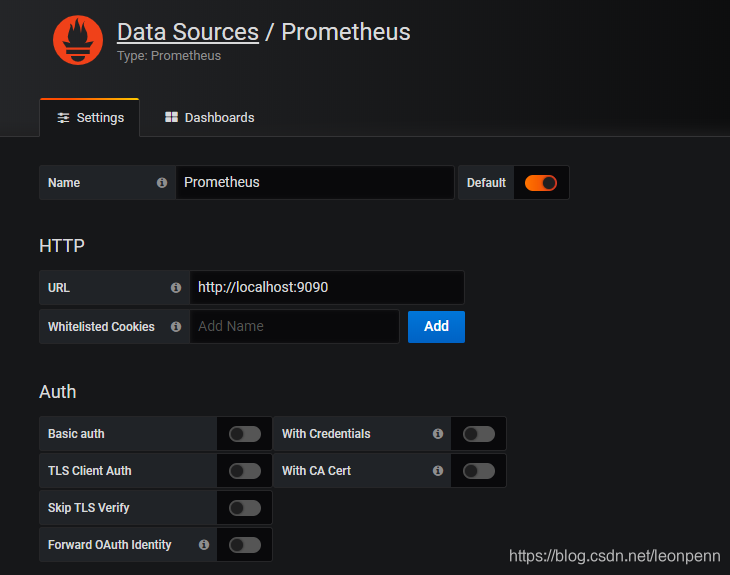
添加datasources:
3、Dashboards导入
以下为基础模板:
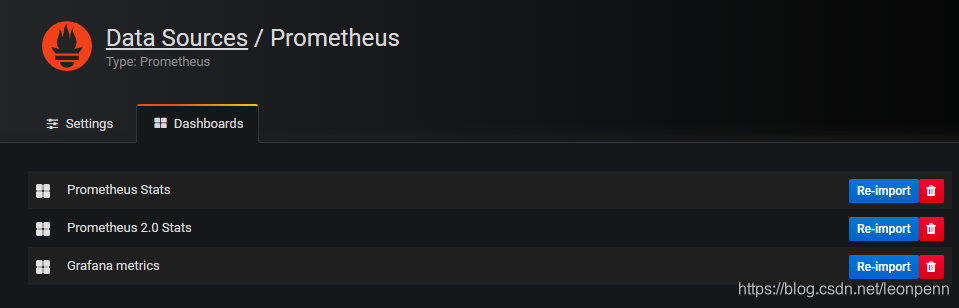
除了基础模板外,可以导入第三方dashboard,例如Percona提供的MySQL相关监控模板:https://github.com/percona/grafana-dashboards
注:导入dashboard时,可能会报错,以安装Breadcrumb Panel Plugin for Grafana为例:
grafana-cli plugins install digiapulssi-breadcrumb-panel
参考文档:
Graphing MySQL performance with Prometheus and Grafana


 3849
3849

 被折叠的 条评论
为什么被折叠?
被折叠的 条评论
为什么被折叠?
 到【灌水乐园】发言


