


目前 Highcharts的默认版本已经进入了 v12系列,所以代码上也有所改动
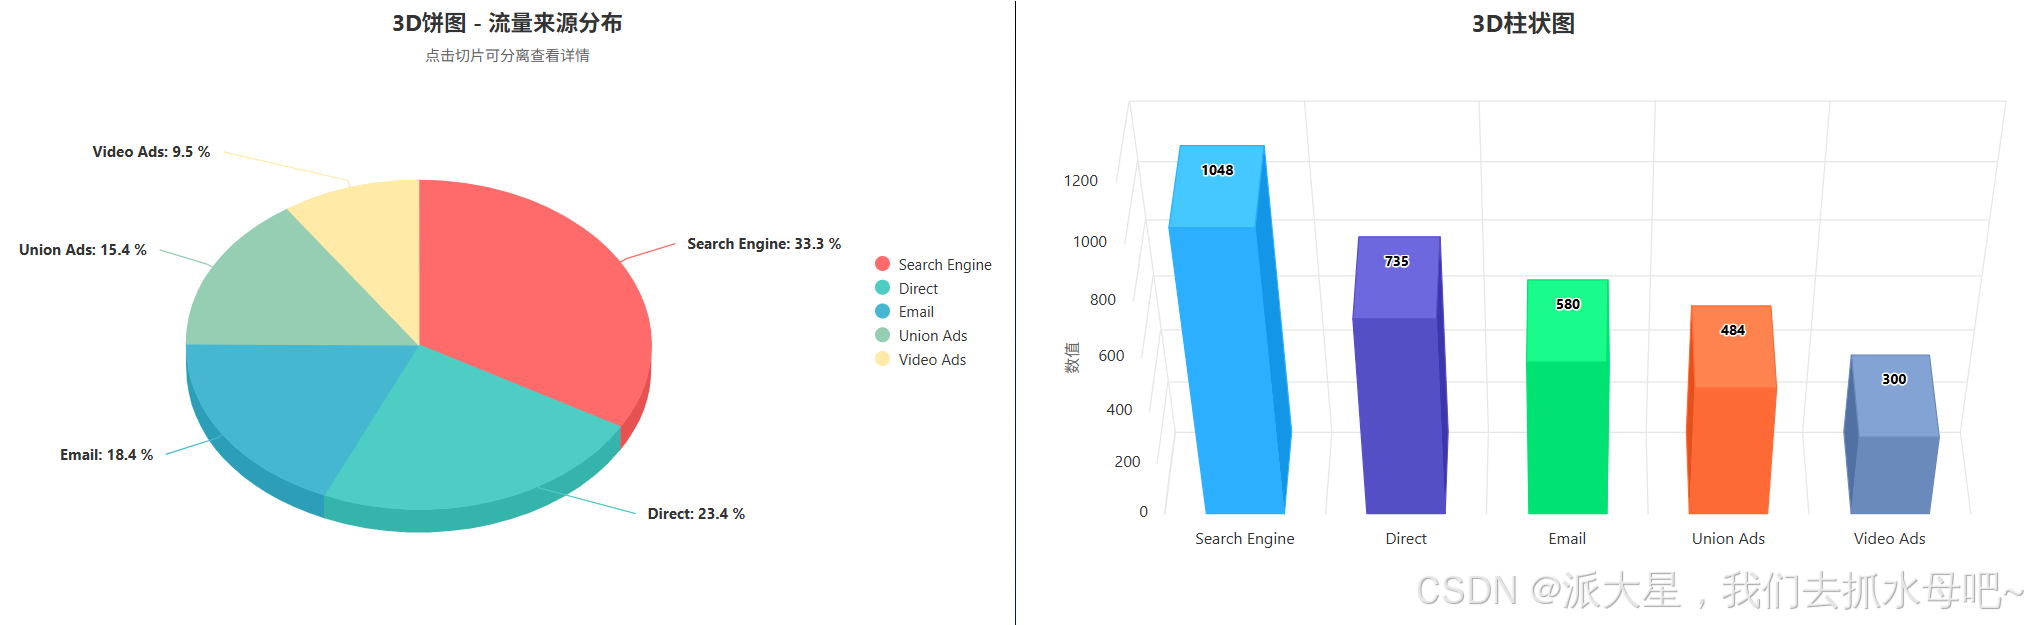
实现效果图
实现代码
安装
// 目前所需要的插件
npm install highcharts
// 目前下载时所用的版本为12.4.0
引入
import Highcharts from 'highcharts';
import 'highcharts/highcharts-3d';
3D饼图完整代码
<template>
  <div id="EchartsPie" class="EchartsPie"></div>
</template>

<script setup>
import Highcharts from 'highcharts';
import 'highcharts/highcharts-3d';

// 设置全局语言选项,修复 Invalid language tag 错误
Highcharts.setOptions({
  lang: {
    locale: 'zh-CN' // 使用标准的简体中文语言标签
  }
});

// 数据
const list = [
  { value: 1048, name: "Search Engine" },
  { value: 735, name: "Direct" },
  { value: 580, name: "Email" },
  { value: 484, name: "Union Ads" },
  { value: 300, name: "Video Ads" },
];

const data = list.map(e => ({
  name: e.name,
  y: e.value,
}));

const queryPie = () => {
  Highcharts.chart('EchartsPie', {
    chart: {
      type: 'pie',
      options3d: {
        enabled: true,
        alpha: 45, // 饼图倾斜角度
        beta: 0,   // 饼图旋转角度
        depth: 35, // 3D饼图的厚度
      },
    },
    title: {
      text: '3D饼图 - 流量来源分布',
      style: {
        fontSize: '18px',
        fontWeight: 'bold'
      }
    },
    subtitle: {
      text: '点击切片可分离查看详情',
      style: {
        fontSize: '12px',
        color: '#666'
      }
    },
    tooltip: {
      pointFormat: '<b>{point.percentage:.1f}%</b>'
    },
    plotOptions: {
      pie: {
        allowPointSelect: true, // 允许点击选择切片
        cursor: 'pointer',
        depth: 35, // 饼图厚度
        dataLabels: {
          enabled: true,
          format: '<b>{point.name}</b>: {point.percentage:.1f} %',
          style: {
            color: '#333',
            fontSize: '12px',
            textOutline: 'none'
          }
        },
        showInLegend: true // 显示图例
      }
    },
    legend: {
      layout: 'vertical',
      align: 'right',
      verticalAlign: 'middle',
      itemStyle: {
        fontSize: '12px',
        color: '#333'
      }
    },
    colors: ['#FF6B6B', '#4ECDC4', '#45B7D1', '#96CEB4', '#FFEAA7'],
    series: [{
      name: '占比',
      data: data,
      colorByPoint: true, // 让每个切片有不同的颜色
    }],
  });
};

import { onMounted } from 'vue';
onMounted(() => {
  queryPie();
});
</script>

<style scoped>
.EchartsPie {
  width: 100%;
  height: 500px;
}
::v-deep .highcharts-credits {
  display: none;
}
</style>
改的时候 刚好写到了3D柱状图,那就也记录下吧
3D柱状图的完整代码
<template>
  <div id="EchartsBar" class="EchartsBar"></div>
</template>

<script setup>
import Highcharts from 'highcharts';
import 'highcharts/highcharts-3d';

// 设置全局语言选项,修复 Invalid language tag 错误
Highcharts.setOptions({
  lang: {
    locale: 'zh-CN' // 使用标准的简体中文语言标签
  }
});

// 数据
const list = [
  { value: 1048, name: "Search Engine" },
  { value: 735, name: "Direct" },
  { value: 580, name: "Email" },
  { value: 484, name: "Union Ads" },
  { value: 300, name: "Video Ads" },
];

const data = list.map(e => ({
  name: e.name,
  y: e.value,
}));

const queryBar = () => {
  Highcharts.chart('EchartsBar', {
    chart: {
      type: 'column',
      options3d: {
        enabled: true,
        alpha: 45,
        beta: 0,
        depth: 100,
      },
    },
    title: {
      text: '3D柱状图',
    },
    tooltip: {
      pointFormat: '<b>{point.y}</b>'
    },
    xAxis: {
      type: 'category',
    },
    yAxis: {
      title: {
        text: '数值',
      },
    },
    legend: {
      enabled: false,
    },
    plotOptions: {
      column: {
        depth: 100,
        dataLabels: {
          enabled: true,
          format: '{point.y}'
        },
      },
    },
    series: [
      {
        name: '数据',
        data: data,
        colorByPoint: true, // 让每个柱子有不同的颜色
      },
    ],
  });
};

import { onMounted } from 'vue';
onMounted(() => {
  queryBar();
});
</script>

<style scoped>
.EchartsBar {
  width: 100%;
  height: 500px;
}
::v-deep .highcharts-credits {
  display: none;
}
</style>


 2845
2845

 被折叠的 条评论
为什么被折叠?
被折叠的 条评论
为什么被折叠?
 到【灌水乐园】发言


