周期性方波-python演示
import numpy as np
import matplotlib.pyplot as plt
from matplotlib.animation import FuncAnimation
T = 2 * np.pi
w0 = 2 * np.pi / T
num_periods = 6
t = np.linspace(-num_periods*np.pi, num_periods*np.pi, 40000)
fig, ax = plt.subplots(figsize=(10, 4.5))
line, = ax.plot([], [], lw=2)
ax.set_xlim(t[0], t[-1])
ax.set_ylim(-0.3, 1.3)
ax.set_xlabel("t")
ax.set_ylabel("x(t)")
ax.grid(True)
title = ax.set_title("")
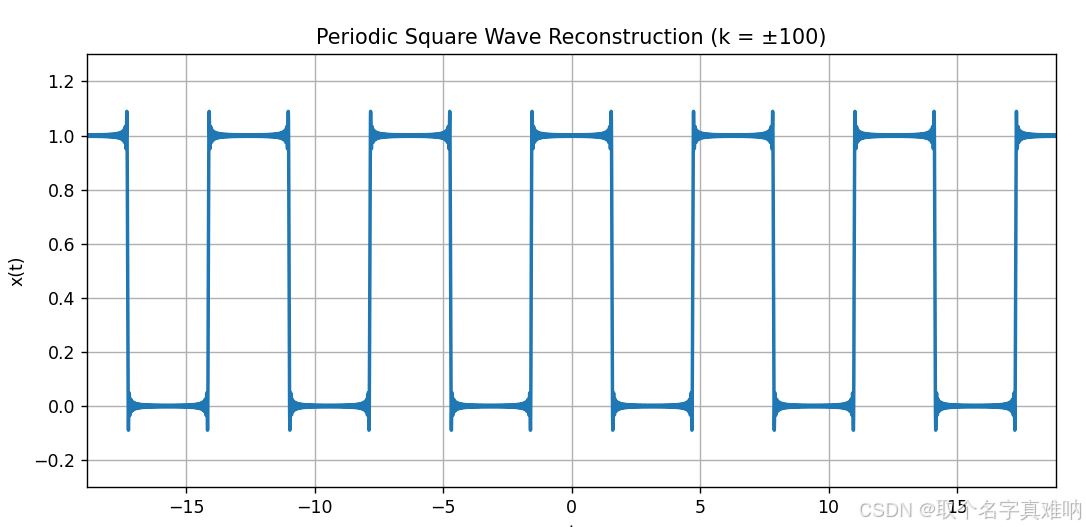
def synthesize(N):
x = np.zeros_like(t, dtype=complex)
for k in range(-N, N + 1):
if k == 0:
ak = 0.5
else:
ak = np.sin(np.pi * k / 2) / (k * np.pi)
x += ak * np.exp(1j * k * w0 * t)
return x.real
def init():
x0 = synthesize(1)
line.set_data(t, x0)
title.set_text("Periodic Square Wave Reconstruction (k = ±1)")
return line, title
def update(N):
x = synthesize(N)
line.set_data(t, x)
title.set_text(f"Periodic Square Wave Reconstruction (k = ±{N})")
return line, title
ani = FuncAnimation(
fig,
update,
frames=range(1, 101),
init_func=init,
interval=100,
blit=False,
repeat=False
)
plt.show()


 369
369

 被折叠的 条评论
为什么被折叠?
被折叠的 条评论
为什么被折叠?
 到【灌水乐园】发言


