
#92 生成AIで自動化するQC七つ道具:特性要因図、チャレンジ AI×100業務(製造業)

製造業の品質管理に欠かせないQC七つ道具。その中でも「特性要因図」は、問題の原因を探る上で強力なツールですが、作成が面倒くさいですね。
せめて原型だけでも、枝が発展していない形でもパワポで保存出来たら・・・
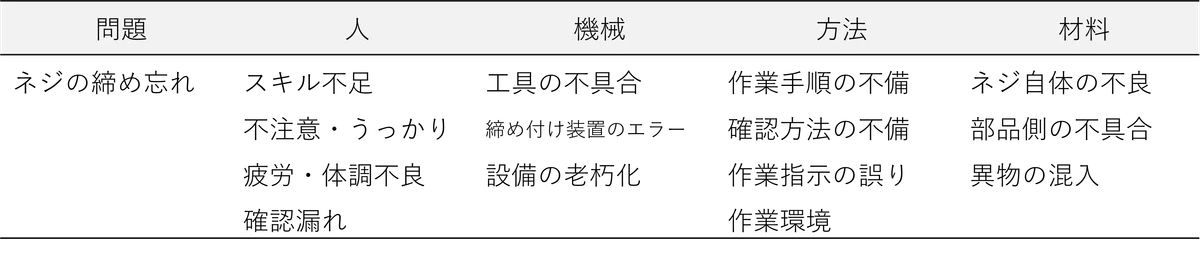
今回は、4Mをcsvファイルに列挙し、それを読み込みます。
■ 参考 QC7つ道具
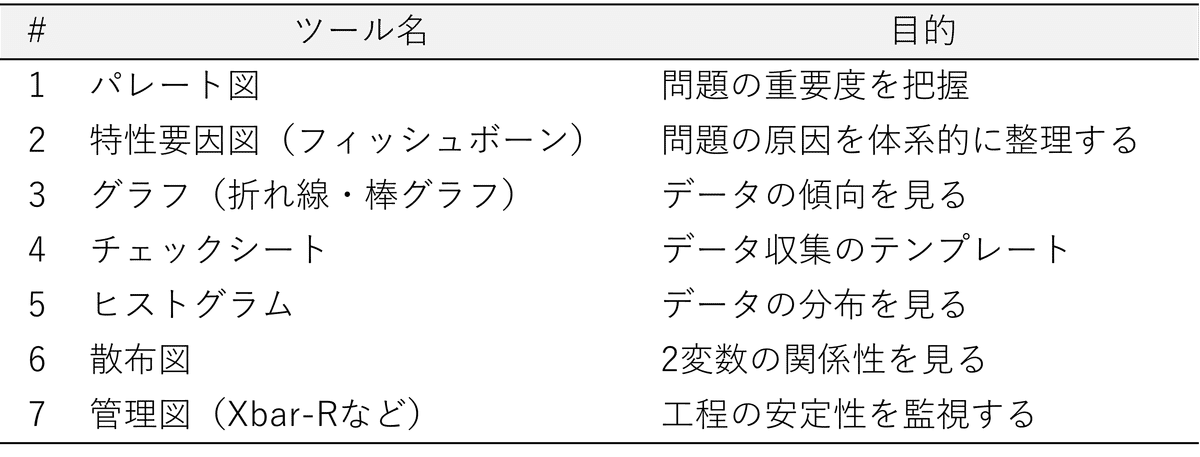
*それでは、スタートです。
*執筆者は以下を参照してください。
使ったツール・準備したこと
Gemini 2.5 Pro(experimental)
Cursor
実行した内容の簡単な流れ
Geminiに次のように聞きました。
特性要因図を作成するコードを生成してください。例を添付します。各要因は、CSVファイルから読み取るようにして・・・(以後、ファイルの構成の説明)
■ ファイルの構成
*今回のコードでは、このcsvファイルを読み取ります。
■ 例の特性要因図
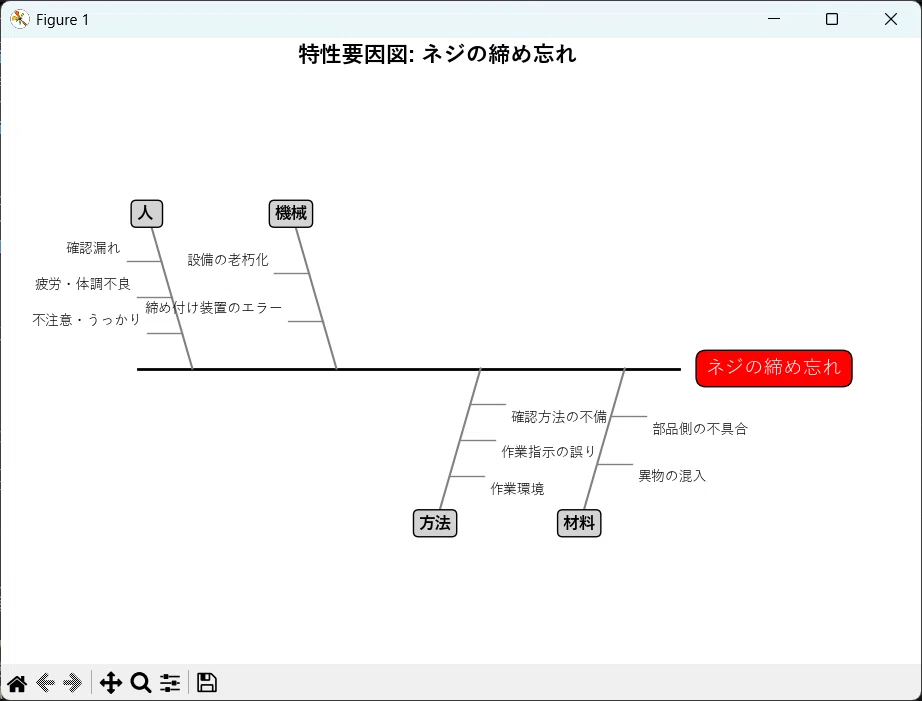
上記は、図での出力ですが、上ほどキレイではありませんが、コードではパワポでも出力するようにしました(ここではその図は省略)。
今後の展開・アイデア
次回取り組みたいこと;
・Pythonでニューラルネットワーク構築に挑戦 → 挫折… やはりWekaが便利だった話
■ 今回のコード
import pandas as pd
import matplotlib.pyplot as plt
import matplotlib.font_manager as fm
import numpy as np
import os
import tkinter as tk
from tkinter import filedialog, messagebox
# python-pptxライブラリが必要 (pip install python-pptx)
try:
    from pptx import Presentation
    from pptx.util import Inches, Pt
    from pptx.enum.shapes import MSO_CONNECTOR
    from pptx.dml.color import RGBColor
    pptx_installed = True
except ImportError:
    pptx_installed = False
    print("警告: 'python-pptx' ライブラリが見つかりません。PowerPoint出力機能は無効になります。")
    print("インストールするには、コマンドプロンプトで 'pip install python-pptx' を実行してください。")


# --- GUIでCSVファイルを選択する関数 ---
def select_csv_file():
    """ファイル選択ダイアログを開き、CSVファイルのパスを取得する"""
    root = tk.Tk()
    root.withdraw() # メインウィンドウを表示しない
    file_path = filedialog.askopenfilename(
        title="特性要因図の元となるCSVファイルを選択してください",
        filetypes=[("CSV files", "*.csv"), ("All files", "*.*")]
    )
    root.destroy() # ダイアログが閉じたらウィンドウを破棄
    return file_path

# --- 保存先を選択する関数を追加 ---
def select_save_location(default_filename, file_type):
    """保存先を選択するダイアログを開く"""
    root = tk.Tk()
    root.withdraw()
    if file_type == 'pptx':
        file_path = filedialog.asksaveasfilename(
            title="PowerPointファイルの保存先を選択してください",
            defaultextension=".pptx",
            initialfile=default_filename,
            filetypes=[("PowerPoint files", "*.pptx"), ("All files", "*.*")]
        )
    elif file_type == 'png':
         file_path = filedialog.asksaveasfilename(
            title="画像ファイルの保存先を選択してください",
            defaultextension=".png",
            initialfile=default_filename,
            filetypes=[("PNG Image", "*.png"), ("All files", "*.*")]
        )
    else:
        file_path = None # 未対応の形式
    root.destroy()
    return file_path

# --- 設定 ---
# output_file_path = 'fishbone_diagram_problem_col.png' # 保存ダイアログで指定するため不要に
problem_column_name = '問題' # 問題が記載されている列のヘッダー名

# --- 日本語フォント設定 (環境に合わせて変更) ---
try:
    # Windowsの日本語フォントを順番に試す
    available_fonts = ['Yu Gothic', 'MS Gothic', 'Meiryo', 'IPAexGothic', 'TakaoPGothic', 'Noto Sans CJK JP'] # Linux等も考慮
    font_found = False

    for font_name in available_fonts:
        try:
            font_path = fm.findfont(fm.FontProperties(family=font_name), fallback_to_default=False) # fallbackをFalseに
            if font_path:
                plt.rcParams['font.family'] = font_name
                print(f"日本語フォント '{font_name}' を設定しました。")
                font_found = True
                break
        except Exception:
            continue # 次のフォントを試す

    if not font_found:
        # フォントが見つからない場合は警告を出す
        print("警告: 利用可能な日本語フォントが見つかりませんでした。")
        print("システムのデフォルトフォントを使用します。文字化けする可能性があります。")
        # デフォルトのsans-serifを使う(多くの環境で何らかのフォントが割り当てられる)
        plt.rcParams['font.family'] = 'sans-serif'


except Exception as e:
    print(f"警告: 日本語フォントの設定中にエラーが発生しました: {e}")
    print("システムのデフォルトフォントを使用します。")
    plt.rcParams['font.family'] = 'sans-serif'

# --- GUIでCSVファイルを選択 ---
csv_file_path = select_csv_file()

# ファイルが選択されなかった場合(キャンセルされた場合)は終了
if not csv_file_path:
    print("ファイルが選択されませんでした。処理を終了します。")
    exit()

print(f"選択されたCSVファイル: {csv_file_path}")

# --- CSVデータの読み込み ---
try:
    # まずUTF-8で試し、失敗したらCP932(Shift-JIS)で試みる
    try:
        df = pd.read_csv(csv_file_path, encoding='utf-8')
    except UnicodeDecodeError:
        print("UTF-8での読み込みに失敗しました。CP932 (Shift-JIS) で再試行します。")
        df = pd.read_csv(csv_file_path, encoding='cp932')
except FileNotFoundError:
    messagebox.showerror("エラー", f"CSVファイル '{os.path.basename(csv_file_path)}' が見つかりません。")
    exit()
except Exception as e:
    messagebox.showerror("エラー", f"CSVファイルの読み込み中にエラーが発生しました:\n{e}")
    exit()

# --- 問題(特性)とカテゴリ、要因の抽出 ---
try:
    # 問題ステートメントを抽出 (指定された列の最初のデータ行)
    if problem_column_name not in df.columns:
        messagebox.showerror("エラー", f"CSVファイルに '{problem_column_name}' 列が見つかりません。")
        exit()
    # 最初の非NaN値を取得するように変更
    problem_statement = df[problem_column_name].dropna().iloc[0] if not df[problem_column_name].dropna().empty else None
    if problem_statement is None: # 問題が空の場合のエラー処理
         messagebox.showerror("エラー", f"'{problem_column_name}' 列に問題が記載されていません。")
         exit()

    # カテゴリ(列名)を取得 (問題列を除く)
    categories = [col for col in df.columns if col != problem_column_name]
    if not categories:
        messagebox.showerror("エラー", "問題列以外のカテゴリ列が見つかりません。")
        exit()

    # カテゴリごとに要因を辞書に格納 (NaNを除外し、問題列のデータも除外)
    factors_by_category = {}
    for col in categories:
        # 問題列のデータ(最初の行)を除外してからNaNを削除
        factors = df[col].iloc[1:].dropna().tolist()
        if factors: # 要因が空でない場合のみ辞書に追加
             factors_by_category[col] = factors


except IndexError:
    messagebox.showerror("エラー", f"CSVファイルが空か、'{problem_column_name}' 列にデータがありません。")
    exit()
except Exception as e:
    messagebox.showerror("エラー", f"CSVデータの処理中に予期せぬエラーが発生しました:\n{e}")
    exit()


# --- 描画 (Matplotlib) ---
fig, ax = plt.subplots(figsize=(14, 8)) # 図のサイズを調整

# 1. 背骨 (Main spine)
spine_y = 0
spine_start_x = 0
spine_end_x = 10
ax.plot([spine_start_x, spine_end_x], [spine_y, spine_y], color='black', linewidth=2)

# 2. 問題(特性)の表示 (Effect box)
problem_box_x = spine_end_x + 0.5
# テキストボックスの自動改行を考慮
problem_text_obj = ax.text(problem_box_x, spine_y, problem_statement,
        ha='left', va='center', fontsize=14, color='white', wrap=True, # wrap=Trueを追加
        bbox=dict(boxstyle='round,pad=0.5', fc='red', ec='black'))

# 描画後にテキストボックスの実際の幅を取得(推定のため不正確な場合あり)
# fig.canvas.draw() # これを実行すると表示前に描画が確定される
# try:
#     problem_bbox = problem_text_obj.get_window_extent(renderer=fig.canvas.get_renderer())
#     problem_width_pixels = problem_bbox.width
#     # ピクセルからデータ座標への変換(概算)
#     problem_width_data = problem_width_pixels / fig.dpi * (ax.get_xlim()[1] - ax.get_xlim()[0]) / fig.get_figwidth()
#     print(f"Estimated problem box width: {problem_width_data}")
# except Exception as e:
#     print(f"テキスト幅の取得中にエラー: {e}")
#     problem_width_data = len(str(problem_statement)) * 0.15 # 取得失敗時の代替

# 3. 大骨と要因の描画 (Major bones and factors)
num_categories = len(categories)
# カテゴリ数に応じて大骨の位置を調整
category_positions = np.linspace(spine_start_x + 1, spine_end_x - 1, num_categories)

bone_length = 2.5 # 大骨のY方向の長さ(調整可能)
factor_bone_length = 0.8 # 要因(中骨)の長さ(調整可能)
angle_deg = 45 # 大骨の角度

for i, category in enumerate(categories):
    cat_x = category_positions[i]
    # カテゴリを交互に上下に配置
    if i < num_categories / 2:  # 最初の半分を上に配置
        factor_va = 'bottom'
        factor_angle_mult = 1
        major_bone_angle_rad = np.radians(90 + angle_deg / 2) # 上向きの角度
    else: # 残りの半分を下に配置
        factor_va = 'top'
        factor_angle_mult = -1
        major_bone_angle_rad = np.radians(-90 - angle_deg / 2) # 下向きの角度

    # 大骨 (Major bone) - 角度をつけて描画
    major_bone_x_end = cat_x + bone_length * np.cos(major_bone_angle_rad) * 0.8 # X方向の長さ調整
    major_bone_y_end = spine_y + bone_length * np.sin(major_bone_angle_rad)
    ax.plot([cat_x, major_bone_x_end], [spine_y, major_bone_y_end], color='gray', linewidth=1.5)


    # カテゴリ名 (Category label) - 大骨の先端に配置
    label_offset = 0.2 # ラベル位置のオフセット
    label_x = major_bone_x_end + label_offset * np.cos(major_bone_angle_rad)
    label_y = major_bone_y_end + label_offset * np.sin(major_bone_angle_rad)
    ax.text(label_x, label_y, category,
            ha='center', va='center', fontsize=12, weight='bold',
            bbox=dict(boxstyle='round,pad=0.3', fc='lightgray', ec='black'))

    # 要因(中骨) (Factors / Minor bones)
    if category in factors_by_category:
        factors = factors_by_category[category]
        num_factors = len(factors)
        # 大骨に沿って要因を配置するための点を計算
        # 要因数が0の場合の除算エラーを防ぐ
        if num_factors > 0:
            factor_points_x = np.linspace(cat_x, major_bone_x_end, num_factors + 2)[1:-1]
            factor_points_y = np.linspace(spine_y, major_bone_y_end, num_factors + 2)[1:-1]
        else:
            factor_points_x, factor_points_y = [], [] # 要因がない場合は空リスト


        for j, factor in enumerate(factors):
            factor_x_start = factor_points_x[j]
            factor_y_start = factor_points_y[j]

            # 中骨の終点計算 (大骨に対して垂直方向、ただし水平にする)
            # 角度はつけずに水平に伸ばす
            factor_x_end = factor_x_start - factor_bone_length * factor_angle_mult * 0.8 # X方向の長さ調整
            factor_y_end = factor_y_start # Y座標は変えない

            # 中骨 (Minor bone)
            ax.plot([factor_x_start, factor_x_end], [factor_y_start, factor_y_end], color='gray', linewidth=1)

            # 要因テキスト (Factor text) - 中骨の少し外側に配置
            text_x_offset = -0.1 * factor_angle_mult
            text_y_offset = 0.1 * (1 if factor_angle_mult > 0 else -1) # 上下方向のオフセット
            ax.text(factor_x_end + text_x_offset, factor_y_end + text_y_offset, factor,
                    ha='right' if factor_angle_mult > 0 else 'left', # 配置方向を調整
                    va=factor_va,
                    fontsize=10, rotation=0) # rotationで角度調整も可能


# --- グラフの調整と表示 ---
# X軸範囲を問題テキストの長さに応じて動的に調整
# 問題テキストボックスの描画後に幅を考慮してxlimを設定するのが理想だが、
# plt.show() 前に正確な幅を取得するのは難しいため、推定値で設定する。
# wrap=True を使ったので、ある程度の長さで折り返されることを期待。
estimated_problem_width = min(len(str(problem_statement)) * 0.15, 4.0) # 推定幅に上限を設定
ax.set_xlim(spine_start_x - 1, problem_box_x + estimated_problem_width + 0.5) # X軸範囲を手動調整
ax.set_ylim(spine_y - bone_length * 1.8, spine_y + bone_length * 1.8) # Y軸範囲を手動調整

ax.axis('off') # 軸を非表示
plt.title(f'特性要因図: {problem_statement}', fontsize=16, weight='bold', pad=20)
plt.tight_layout(pad=1.5) # レイアウト調整

# --- 出力形式の選択 ---
def select_output_format():
    """出力形式を選択するダイアログを表示"""
    root = tk.Tk()
    root.withdraw()

    # pptxライブラリがインストールされていない場合は、PowerPoint選択肢を無効化
    if pptx_installed:
        message = "PowerPointファイルとして出力しますか?\n\n'はい' → PowerPoint形式(.pptx)\n'いいえ' → 画像形式(.png)"
        ask_func = messagebox.askyesno
    else:
        message = "PowerPoint出力に必要なライブラリ ('python-pptx') がありません。\n画像形式(.png)で出力します。"
        ask_func = messagebox.showinfo # 情報表示のみ

    # askyesno または showinfo を実行
    if pptx_installed:
         result = ask_func(
            "出力形式の選択",
            message,
            icon='question'
        )
    else:
        ask_func("出力形式", message, icon='warning')
        result = False # 強制的に画像形式を選択

    root.destroy()
    return result

def create_editable_powerpoint(problem_statement, categories, factors_by_category, output_pptx_path):
    """編集可能な特性要因図をPowerPointファイルとして作成"""
    if not pptx_installed:
        messagebox.showerror("エラー", "PowerPoint出力に必要な 'python-pptx' ライブラリがインストールされていません。")
        return False
    try:
        print("PowerPointファイルの作成を開始します...")

        # プレゼンテーションの作成
        prs = Presentation()
        print("プレゼンテーションオブジェクトを作成しました")

        # スライドの追加(白紙レイアウト)
        slide_layout = prs.slide_layouts[6] # 6は白紙レイアウト
        slide = prs.slides.add_slide(slide_layout)
        print("スライドを追加しました")

        # スライドのサイズを取得(EMU単位で取得)
        slide_width = prs.slide_width
        slide_height = prs.slide_height
        print(f"スライドサイズ: 幅={slide_width} EMU, 高さ={slide_height} EMU")

        # --- 配置パラメータ (Inches単位で調整) ---
        margin = Inches(0.5)
        spine_left_inch = 1.5
        spine_right_inch = 8.5
        spine_y_inch = 3.75 # 16:9 スライドの中央付近
        category_bone_length_inch = 1.5
        factor_bone_length_inch = 0.6
        factor_text_offset_inch = 0.1
        category_label_offset_inch = 0.2

        # EMUに変換
        spine_left = int(Inches(spine_left_inch))
        spine_right = int(Inches(spine_right_inch))
        spine_y = int(Inches(spine_y_inch))
        category_bone_length = int(Inches(category_bone_length_inch))
        factor_bone_length = int(Inches(factor_bone_length_inch))
        factor_text_offset = int(Inches(factor_text_offset_inch))
        category_label_offset = int(Inches(category_label_offset_inch))

        print(f"背骨の座標 (EMU): 左={spine_left}, 右={spine_right}, Y={spine_y}")

        # 中心線(背骨)の描画
        line = slide.shapes.add_connector(
            MSO_CONNECTOR.STRAIGHT,
            spine_left, spine_y,
            spine_right, spine_y
        )
        line.line.color.rgb = RGBColor(0, 0, 0) # 黒色
        line.line.width = Pt(2.0)
        print("背骨を描画しました")

        # 問題(特性)のテキストボックス
        problem_box_width = Inches(2.5) # 幅を調整
        problem_box_height = Inches(0.8) # 高さを調整
        problem_box_left = spine_right + Inches(0.1)
        problem_box_top = spine_y - problem_box_height / 2
        problem_box = slide.shapes.add_textbox(
            int(problem_box_left), int(problem_box_top),
            int(problem_box_width), int(problem_box_height)
        )
        tf = problem_box.text_frame
        tf.text = str(problem_statement) # 文字列に変換
        tf.word_wrap = True # 自動改行を有効に
        p = tf.paragraphs[0]
        p.font.size = Pt(12)
        p.font.bold = True
        p.font.name = 'Yu Gothic' # フォント指定 (環境依存)
        # 背景色と枠線
        problem_box.fill.solid()
        problem_box.fill.fore_color.rgb = RGBColor(255, 100, 100) # 少し濃い赤
        problem_box.line.color.rgb = RGBColor(0, 0, 0)
        problem_box.line.width = Pt(1.0)
        print("問題テキストボックスを追加しました")

        # カテゴリと要因の配置
        num_categories = len(categories)
        # カテゴリ間のスペースを確保しつつ配置
        category_positions_x = np.linspace(spine_left + Inches(0.5), spine_right - Inches(0.5), num_categories)
        print(f"カテゴリ数: {num_categories}")

        for i, category in enumerate(categories):
            print(f"\nカテゴリ {i+1}/{num_categories} '{category}' の処理を開始")

            # カテゴリの位置を計算
            x = int(category_positions_x[i])

            # 上下交互に配置
            if i < num_categories / 2:
                y_direction = -1  # 上向き
                major_bone_angle_deg = 60 # 上向きの角度
                factor_ha = 'right' # 要因テキストの水平位置
                factor_va = 'bottom' # 要因テキストの垂直位置
            else:
                y_direction = 1   # 下向き
                major_bone_angle_deg = -60 # 下向きの角度
                factor_ha = 'left'  # 要因テキストの水平位置
                factor_va = 'top'   # 要因テキストの垂直位置

            major_bone_angle_rad = np.radians(major_bone_angle_deg)

            # カテゴリの骨を描画 (角度付き)
            category_bone_end_x = int(x + category_bone_length * np.cos(major_bone_angle_rad))
            category_bone_end_y = int(spine_y + category_bone_length * np.sin(major_bone_angle_rad))

            category_line = slide.shapes.add_connector(
                MSO_CONNECTOR.STRAIGHT,
                x, spine_y,
                category_bone_end_x, category_bone_end_y
            )
            category_line.line.color.rgb = RGBColor(128, 128, 128) # 灰色
            category_line.line.width = Pt(1.5)
            print(f"カテゴリ '{category}' の骨を描画しました (角度付き)")

            # カテゴリ名のテキストボックス (骨の先端に配置)
            label_x = int(category_bone_end_x + category_label_offset * np.cos(major_bone_angle_rad))
            label_y = int(category_bone_end_y + category_label_offset * np.sin(major_bone_angle_rad))
            cat_box_width = Inches(1.5)
            cat_box_height = Inches(0.4)
            # テキストボックスが重ならないように微調整
            label_x_adj = label_x - cat_box_width / 2
            label_y_adj = label_y - cat_box_height / 2

            category_box = slide.shapes.add_textbox(
                int(label_x_adj), int(label_y_adj),
                int(cat_box_width), int(cat_box_height)
            )
            tf_cat = category_box.text_frame
            tf_cat.text = category
            tf_cat.word_wrap = True
            p_cat = tf_cat.paragraphs[0]
            p_cat.font.size = Pt(11)
            p_cat.font.bold = True
            p_cat.font.name = 'Yu Gothic'
            # 背景色と枠線
            category_box.fill.solid()
            category_box.fill.fore_color.rgb = RGBColor(220, 220, 220) # 薄い灰色
            category_box.line.color.rgb = RGBColor(0, 0, 0)
            category_box.line.width = Pt(0.5)
            print(f"カテゴリ '{category}' のテキストボックスを追加しました")

            # 要因の追加
            if category in factors_by_category:
                factors = factors_by_category[category]
                num_factors = len(factors)
                print(f"カテゴリ '{category}' の要因数: {num_factors}")

                if num_factors > 0:
                    # 大骨に沿って要因の開始点を計算
                    factor_start_points_x = np.linspace(x, category_bone_end_x, num_factors + 2)[1:-1]
                    factor_start_points_y = np.linspace(spine_y, category_bone_end_y, num_factors + 2)[1:-1]

                    for j, factor in enumerate(factors):
                        factor_start_x = int(factor_start_points_x[j])
                        factor_start_y = int(factor_start_points_y[j])

                        # 要因の線を描画 (水平に)
                        factor_line_end_x = int(factor_start_x + factor_bone_length * (-1 if y_direction < 0 else 1)) # X方向の向きを調整
                        factor_line_end_y = factor_start_y

                        factor_line = slide.shapes.add_connector(
                            MSO_CONNECTOR.STRAIGHT,
                            factor_start_x, factor_start_y,
                            factor_line_end_x, factor_line_end_y
                        )
                        factor_line.line.color.rgb = RGBColor(128, 128, 128)
                        factor_line.line.width = Pt(1.0)

                        # 要因のテキストボックス
                        factor_box_width = Inches(1.8)
                        factor_box_height = Inches(0.3)
                        factor_box_left = factor_line_end_x + factor_text_offset * (-1 if y_direction < 0 else 1)
                        factor_box_top = factor_line_end_y - factor_box_height / 2

                        # X座標の調整(右端/左端に合わせる)
                        if y_direction < 0: # 上向きの場合、テキストは線の左
                            factor_box_left = factor_line_end_x - factor_box_width - factor_text_offset
                        else: # 下向きの場合、テキストは線の右
                            factor_box_left = factor_line_end_x + factor_text_offset


                        factor_box = slide.shapes.add_textbox(
                            int(factor_box_left), int(factor_box_top),
                            int(factor_box_width), int(factor_box_height)
                        )
                        tf_factor = factor_box.text_frame
                        tf_factor.text = str(factor) # 文字列に変換
                        tf_factor.word_wrap = True
                        p_factor = tf_factor.paragraphs[0]
                        p_factor.font.size = Pt(10)
                        p_factor.font.name = 'Yu Gothic'
                        print(f"  要因 '{factor}' を追加しました")

        # タイトルを追加しない(問題ステートメントが図の一部として機能するため)
        # print("タイトルを追加しました")

        # ファイルの保存
        print(f"PowerPointファイルを保存します: {output_pptx_path}")
        try:
            prs.save(output_pptx_path)
            print(f"PowerPointファイルを '{output_pptx_path}' として保存しました")
            return True
        except Exception as save_error:
            messagebox.showerror("保存エラー", f"ファイル保存中にエラーが発生しました:\n{save_error}")
            return False

    except Exception as e:
        messagebox.showerror("作成エラー", f"PowerPointファイルの作成中にエラーが発生しました:\n{e}")
        import traceback
        print("詳細なエラー情報:")
        print(traceback.format_exc())
        return False

# --- メイン処理 ---

# まず出力形式を選択する
is_pptx = select_output_format() # ★★★ この行を追加 ★★★

# 選択された形式に応じて処理を分岐
if is_pptx:
    # PowerPoint形式で出力(編集可能な形式)
    default_filename = f'{problem_statement}_特性要因図.pptx' # CSV名からデフォルトファイル名生成
    output_pptx_path = select_save_location(default_filename, 'pptx')

    if output_pptx_path:  # ファイルパスが選択された場合
        print(f"選択された保存先: {output_pptx_path}")
        if create_editable_powerpoint(problem_statement, categories, factors_by_category, output_pptx_path):
            messagebox.showinfo("成功", f"特性要因図を編集可能なPowerPointファイルとして保存しました:\n{output_pptx_path}")
        else:
            messagebox.showerror("失敗", "PowerPointファイルの作成に失敗しました。")
    else:
        print("PowerPointファイルの保存がキャンセルされました。")
else:
    # 画像形式で出力
    default_filename = f'{problem_statement}_特性要因図.png'
    output_png_path = select_save_location(default_filename, 'png')

    if output_png_path:
        try:
            plt.savefig(output_png_path, dpi=300, bbox_inches='tight')
            messagebox.showinfo("成功", f"特性要因図を画像ファイルとして保存しました:\n{output_png_path}")
        except Exception as e:
            messagebox.showerror("保存エラー", f"画像ファイルの保存中にエラーが発生しました:\n{e}")
    else:
        print("画像ファイルの保存がキャンセルされました。")


# --- 画面への表示 (常に表示) ---
print("グラフを画面に表示します...")
plt.show()
print("処理が完了しました。")
