
#45 Pythonで始める回帰分析(多次数)、チャレンジ AI×100業務(製造業)

前回、過去の設計データや試験データをもとに性能を予測するような、設計者目線の回帰分析を取り上げ、Pythonで形にしてみました。前回は単回帰でしたので、今回は2次以上の多次数を扱います。
それでは、スタートです。
*執筆者は以下を参照してください。
使ったツール・準備したこと
Visual Studio Code環境下でのPython
Chat GPT 4o -> GPT 4.5
やってみたこと|コード・ステップ紹介
実行した内容の簡単な流れ
ChatGPT 4oへの会話:
上の内容を参考に重回帰分析の別のコードを生成してください。 ・CSVファイルをよみとり ・Y、及びX(3因子まで)を入力 ・重回帰分析 ・出力は、予測式、各因子のP値、R値、分散分析の結果
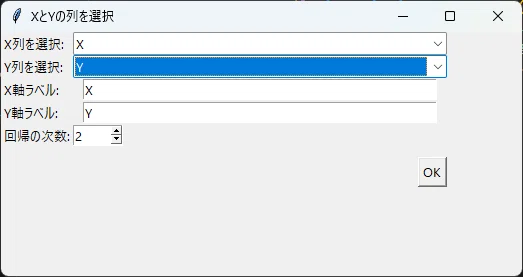
下の画面で、X, Yを選択し、フィッティングする次数を決めます。本アプリは5次までできるようにしています。
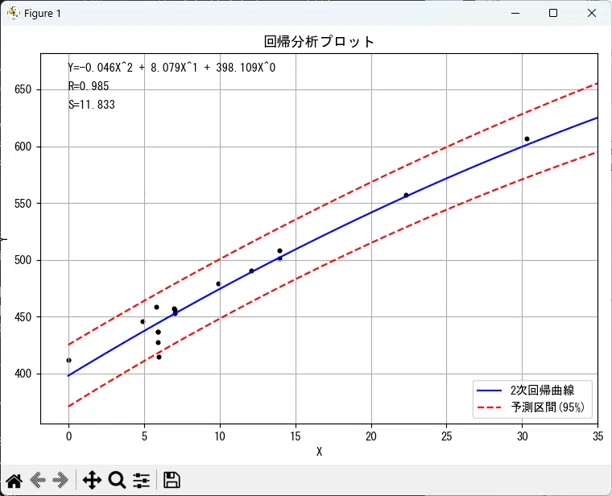
グラフは画像でアクティブにはなりませんので、軸範囲の設定GUIにて横軸、縦軸の範囲を設定するようにしています。
今回もGPT-4oで進めていましたが、プロンプトが悪いのか、なぜかうまく収束しませんでした。コードに反映せず、うまく描画できないため、GPT-4.5に切り替え実施しました。
今後の展開・アイデア
次回取り組みたいこと
・重回帰分析です。
■ 今回のコードです。
import pandas as pd
import numpy as np
import tkinter as tk
from tkinter import filedialog, ttk, messagebox
import matplotlib.pyplot as plt
from scipy.stats import t
import matplotlib
matplotlib.rcParams['font.family'] = 'MS Gothic'

# CSVファイル選択
root = tk.Tk()
root.withdraw()
file_path = filedialog.askopenfilename(title="CSVファイルを選択", filetypes=[("CSV files", "*.csv")])
if not file_path:
    raise Exception("ファイルが選択されていません。");

# CSV読み込み
try:
    df = pd.read_csv(file_path, encoding="cp932", engine='python')
except Exception:
    df = pd.read_csv(file_path, encoding="utf-8", engine='python')

# GUIによるX, Y列とラベル選択
root = tk.Tk()
root.title("XとYの列を選択")
root.geometry("600x250")

x_var = tk.StringVar(root)
y_var = tk.StringVar(root)
xlabel_var = tk.StringVar(root)
ylabel_var = tk.StringVar(root)
degree_var = tk.IntVar(root, value=1)

x_var.set(df.columns[0])
y_var.set(df.columns[1] if len(df.columns) > 1 else df.columns[0])
xlabel_var.set(x_var.get())
ylabel_var.set(y_var.get())

# X列選択時にラベルを自動更新する
def update_xlabel(*args):
    xlabel_var.set(x_var.get())
x_var.trace_add('write', update_xlabel)

# Y列選択時にラベルを自動更新する
def update_ylabel(*args):
    ylabel_var.set(y_var.get())
y_var.trace_add('write', update_ylabel)

# GUIレイアウト
tk.Label(root, text="X列を選択:").grid(row=0, column=0, sticky='w')
ttk.Combobox(root, textvariable=x_var, values=list(df.columns), state="readonly", width=50).grid(row=0, column=1)
tk.Label(root, text="Y列を選択:").grid(row=1, column=0, sticky='w')
ttk.Combobox(root, textvariable=y_var, values=list(df.columns), state="readonly", width=50).grid(row=1, column=1)
tk.Label(root, text="X軸ラベル:").grid(row=2, column=0, sticky='w')
tk.Entry(root, textvariable=xlabel_var, width=50).grid(row=2, column=1)
tk.Label(root, text="Y軸ラベル:").grid(row=3, column=0, sticky='w')
tk.Entry(root, textvariable=ylabel_var, width=50).grid(row=3, column=1)
tk.Label(root, text="回帰の次数:").grid(row=4, column=0, sticky='w')
tk.Spinbox(root, from_=1, to=5, textvariable=degree_var, width=5).grid(row=4, column=1, sticky='w')

def submit():
    root.quit()
    root.destroy()

tk.Button(root, text="OK", command=submit).grid(row=5, column=1, pady=10, sticky='e')
root.mainloop()

# データ準備(数値型へ安全に変換)
x = pd.to_numeric(df[x_var.get()], errors='coerce').values.flatten()
y = pd.to_numeric(df[y_var.get()], errors='coerce').values.flatten()

# NaNを含む行を除去
mask = ~np.isnan(x) & ~np.isnan(y)
x = x[mask]
y = y[mask]

# 多項式回帰
try:
    coefs = np.polyfit(x, y, degree_var.get())
except np.linalg.LinAlgError:
    messagebox.showerror("エラー", "回帰計算が収束しませんでした。次数を下げて再試行してください。");
    raise

p = np.poly1d(coefs)
y_pred = p(x)
r = np.corrcoef(y, y_pred)[0, 1]

# プロット用データ
x_range = np.linspace(x.min(), x.max(), 100)
y_fit = p(x_range)

# 標準誤差と予測区間の計算
se = np.sqrt(np.sum((y - y_pred)**2) / (len(x) - degree_var.get() - 1))
mean_x = np.mean(x)
t_val = t.ppf(0.975, len(x)-degree_var.get()-1)
y_std_error = se * np.sqrt(1 + 1/len(x) + (x_range - mean_x)**2 / np.sum((x - mean_x)**2))
y_upper = y_fit + t_val * y_std_error
y_lower = y_fit - t_val * y_std_error

# 軸範囲設定用の変数
x_min_var = tk.StringVar()
x_max_var = tk.StringVar()
y_min_var = tk.StringVar()
y_max_var = tk.StringVar()

def open_axis_gui():
    gui = tk.Toplevel()
    gui.title("軸範囲の設定")
    gui.geometry("400x200")

    tk.Label(gui, text="X軸 最小値:").grid(row=0, column=0)
    tk.Entry(gui, textvariable=x_min_var).grid(row=0, column=1)
    tk.Label(gui, text="X軸 最大値:").grid(row=1, column=0)
    tk.Entry(gui, textvariable=x_max_var).grid(row=1, column=1)
    tk.Label(gui, text="Y軸 最小値:").grid(row=2, column=0)
    tk.Entry(gui, textvariable=y_min_var).grid(row=2, column=1)
    tk.Label(gui, text="Y軸 最大値:").grid(row=3, column=0)
    tk.Entry(gui, textvariable=y_max_var).grid(row=3, column=1)

    def apply_and_plot():
        try:
            current_xlim = plt.gca().get_xlim()
            current_ylim = plt.gca().get_ylim()
            xlim = (float(x_min_var.get()) if x_min_var.get() else current_xlim[0],
                    float(x_max_var.get()) if x_max_var.get() else current_xlim[1])
            ylim = (float(y_min_var.get()) if y_min_var.get() else current_ylim[0],
                    float(y_max_var.get()) if y_max_var.get() else current_ylim[1])
            plot_regression(xlim, ylim)
        except ValueError:
            messagebox.showerror("エラー", "数値を正しく入力してください。")

    tk.Button(gui, text="再描画", command=apply_and_plot).grid(row=4, column=1, pady=10)
    gui.bind('<Return>', lambda event: apply_and_plot())

# 描画関数(軸指定対応、前のグラフを閉じる)
active_fig = None

def plot_regression(xlim=None, ylim=None):
    global active_fig
    if active_fig:
        plt.close(active_fig)
    active_fig = plt.figure(figsize=(10, 6))
    plt.scatter(x, y, color='black', s=10)
    plt.plot(x_range, y_fit, color='blue', label=f'{degree_var.get()}次回帰曲線')
    plt.plot(x_range, y_upper, 'r--', label='予測区間(95%)')
    plt.plot(x_range, y_lower, 'r--')
    plt.title('回帰分析プロット')
    plt.xlabel(xlabel_var.get())
    plt.ylabel(ylabel_var.get())
    equation = " + ".join([f"{c:.3f}X^{degree_var.get() - i}" for i, c in enumerate(coefs)])
    plt.text(0.05, 0.95, f"Y={equation}", transform=plt.gca().transAxes)
    plt.text(0.05, 0.90, f"R={r:.3f}", transform=plt.gca().transAxes)
    plt.text(0.05, 0.85, f"S={se:.3f}", transform=plt.gca().transAxes)
    if xlim:
        plt.xlim(xlim)
    if ylim:
        plt.ylim(ylim)
    plt.grid()
    plt.legend()
    plt.tight_layout()
    plt.show()

# 初回プロットと軸設定GUI表示
open_axis_gui()
plot_regression()
