
Memo for WOW2025 | Week 17 | Can you switch measures?

課題
Requirements
Core Challenge
Size 1000 x 1000
1 sheet
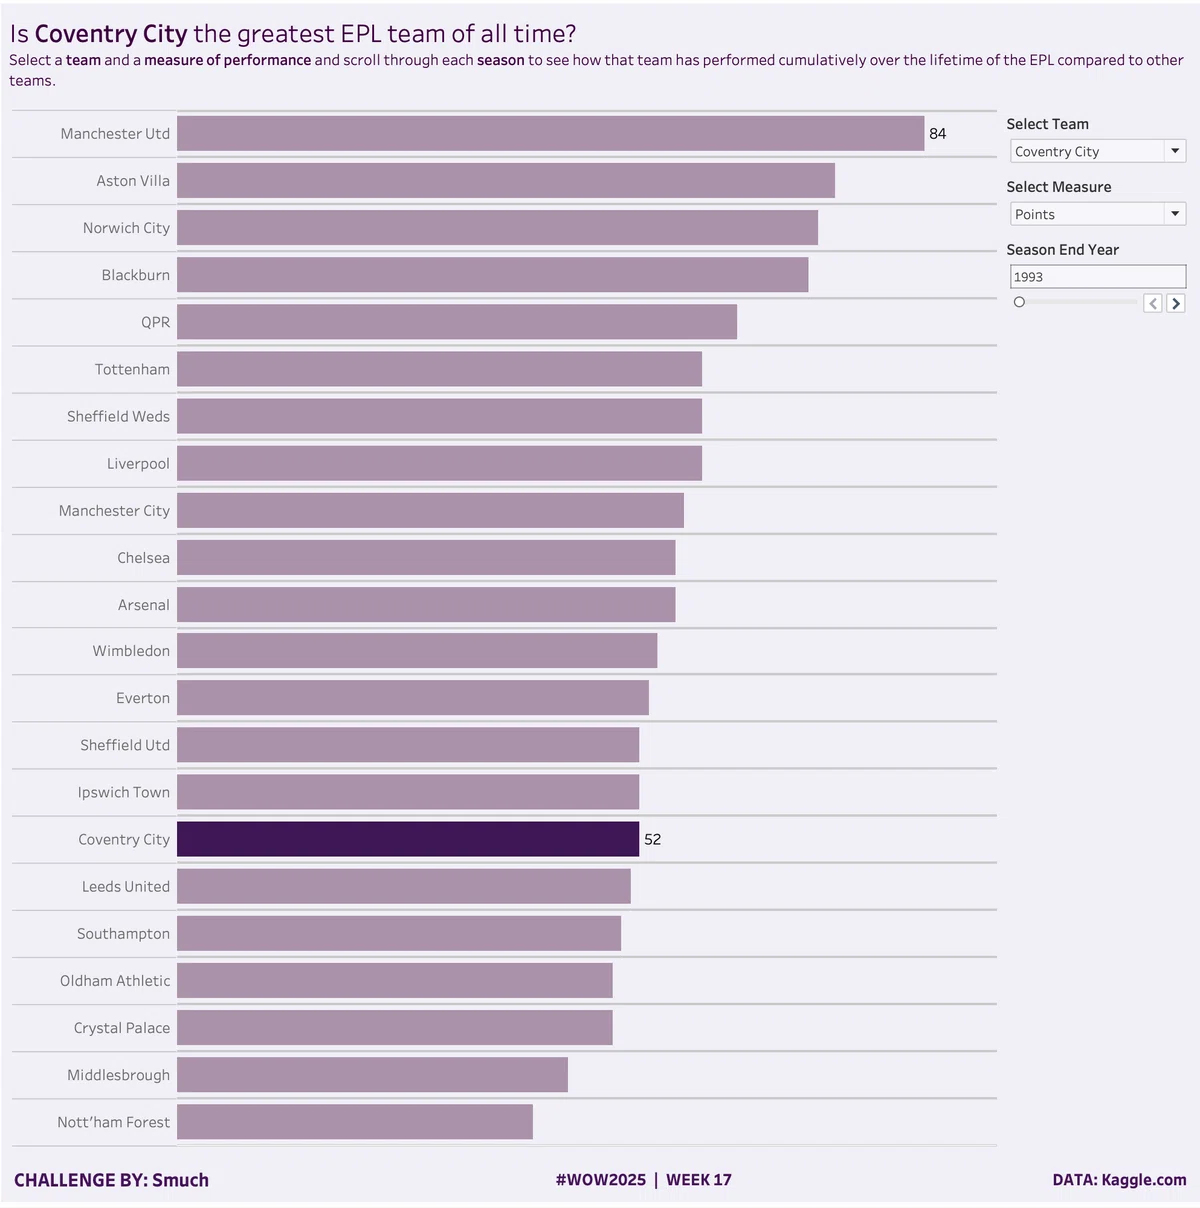
Create a bar chart that displays the selected cumulative measure for each team for each season.
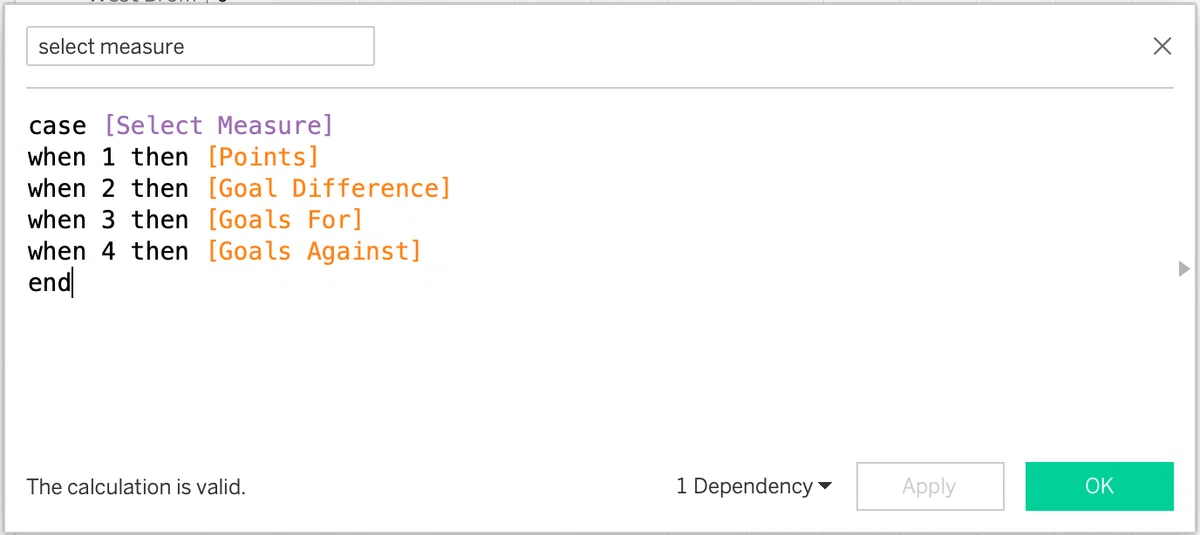
The user can select one of the 4 measures : Points, Goal Difference, Goals For or Goals Against
Sort the data from best to worse – in the case of Goals Conceded, the lower the number the better
Allow the user to select a single team and highlight them in a different colour on the chart
Allow the user to manually scroll through each season to see how the team’s position changes throughout the seasons – note how the bars transition as you click through each season.
Teams should only be displayed in the bar chart once they earn some points in a season (that is in 1993 only 22 teams should be listed, but by 2024, all 51 teams should be displayed.
Label the bar for the team selected as well as the team in 1st place.
Display on the tooltip both the current season’s selected measure along with the cumulated value.
Include the selected team in the title
Match formatting. Use the same colour scheme, or choose your own. Colours used
background – pale purple #f1eff6
bars- mid purple #ac92aa
selected bar and font dark purple #3e1756
Bonus Challenge
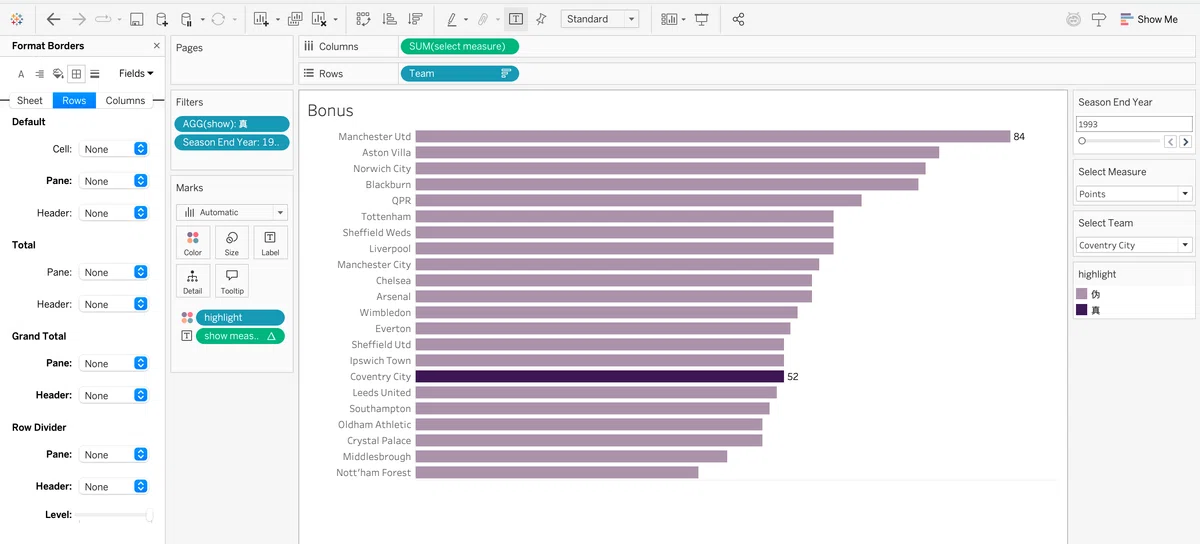
As above, but display the bars centrally on a horizontal line, with the team names aligned centrally to the left hand side.
Pay attention to how the display looks for the lower teams when Goal Difference is selected.
There should be minimal spacing between the team name and the start of the line.
Step by Step
Dataset
データは整備済みですが、元々は Kaggle.com から取得されたものです。こちらからご覧いただけます:こちら。

パラメーターの作成:Select Measure とそれに対応する計算フィールド


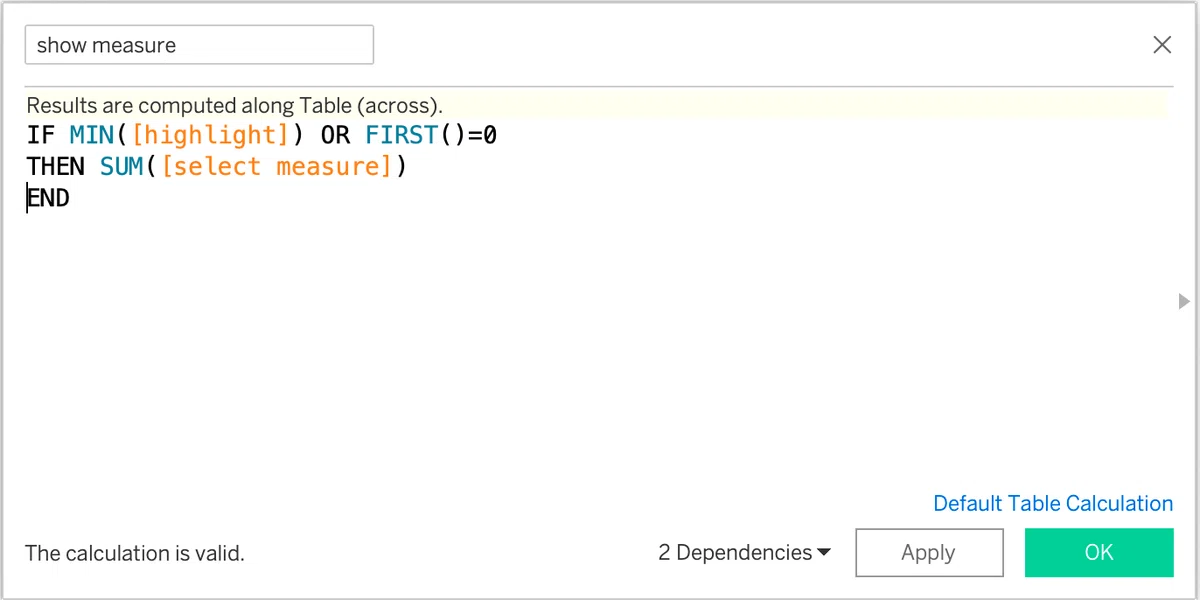
表示用の計算フィールドを追加する


ハイライト表示




ダッシュボードの準備


Bonus


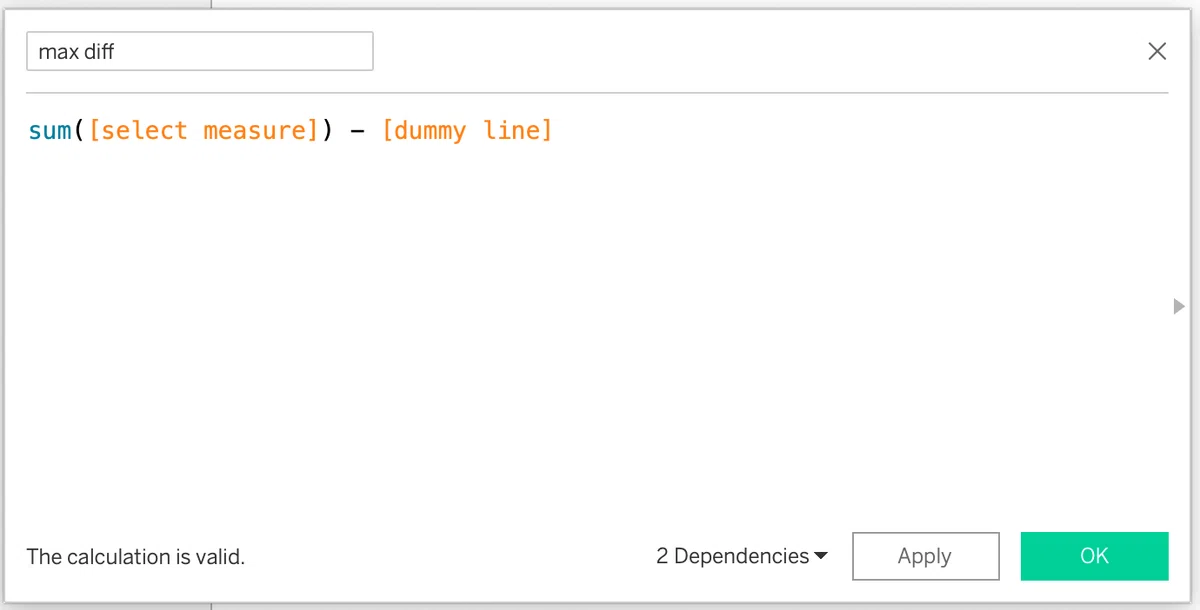


サマリー
今回のWOWチャレンジでは、ビジュアライゼーション用パラメーターおよび最大値の同時表示に関する実装がテーマでした。
主に 表計算(FIRST) と ハイライト用パラメーターを組み合わせて表示する方法を紹介しました。
また、棒グラフ(Bar Plot)とガント棒グラフ(Gantt Bar Plot)を組み合わせた可視化ビューも一例として提示しました。ある意味、1つのテクニックとも言えるでしょう。
出題者の方に感謝申し上げます。そして、このチャレンジが皆様の学びに繋がれば幸いです。
https://public.tableau.com/app/profile/liang.shang3807/viz/wow2025week17/wow-2025-week-17Bouns
