
If you’re a data nerd like me and want to transform exercise from a chore into a data adventure, then you are in the right place. This post will show you how easy it is to make your own exercise dataset as well as how to access and open it using Python.
Growing up, I was never the "fit" kid. I was a bit overweight and never gave exercise enough of a chance for it to be considered fun instead of a chore. Like many things, this changed when the pandemic hit in March of 2020. By late April, I had stayed inside too long and needed a change. I did not want to risk contact with anyone, but I needed to get outside. I chose biking.
From a brief foray into running – a chore that hurt my knees – I knew about and reinstalled the Strava fitness app. This app is capable of recording where you ran or biked and other fun stats like total distance, average speed and more. I figured that if I were to take up biking, I might as well have the numbers to prove it. My rides started off as 30-minute trips on sidewalks that slowly explored the surrounding area of my apartment. After a while, I got curious and explored back paths and low-traffic roads and discovered the next town over. On Strava, I had hit my first milestone: 10 miles in one ride. From this point on, biking was not exercise – it was an adventure. I kept exploring and tracked my milestones on Strava. I hit 20 miles, then 30, 40 and eventually 50 miles.
By July of 2020 I had biked 1,000 miles over 76 different rides. Not only did I feel better, but I now had recorded my very own fitness journey as a dataset. In this post, I will show how to gather this data for Exploratory Data Analysis (EDA) and explain its GPX format for parsing. Through several future posts, I will share my fitness journey through data and show you how to analyze your own. If you do not have your own fitness data yet, create some! Whether it’s running, riding or something else, this post will show you how to start your own exercise data adventure.
Disclaimer: there are many fitness apps out there, so try out whichever is most interesting to you. Strava imprinted on me early and I have found it easy to work with. The main goal is to combine data exploration with exercise! Additionally, I have paid the subscription for Strava because I enjoy it enough, however you do not need to subscribe to access your data!
Accessing Ride Data on Strava
Finding your ride data on Strava is actually pretty easy. Assuming you have at least one ride to analyze–and if you don’t, get out make one! – the first step is to log into your account on Strava’s website. Once you do, you will see your dashboard. If you follow anyone else’s activities, you will see them in the center by default. What we care about is your profile summary in the upper left.
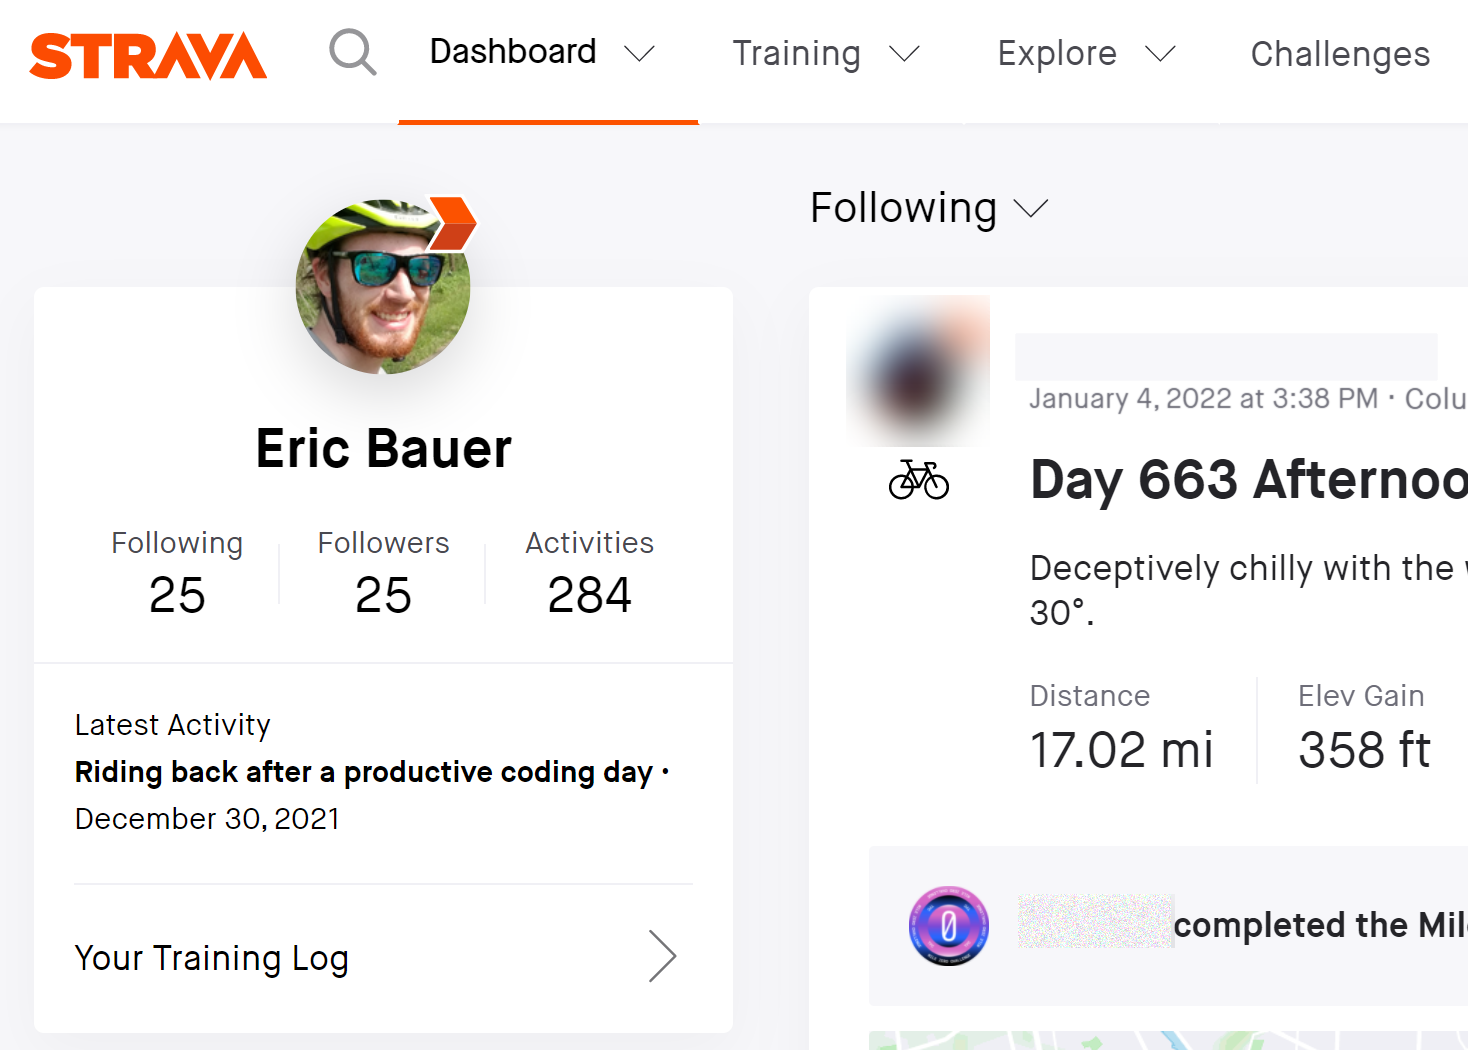
Click on the "activities number" in your profile summary box to go to a list of your activities. Then sort the rides in descending distance order so you can start the exploration with your longest activity. For me, this ride also does not start at my home address, so it is easy to share without any privacy concerns. We’ll explore how to add privacy bubbles to your data in a future blog.
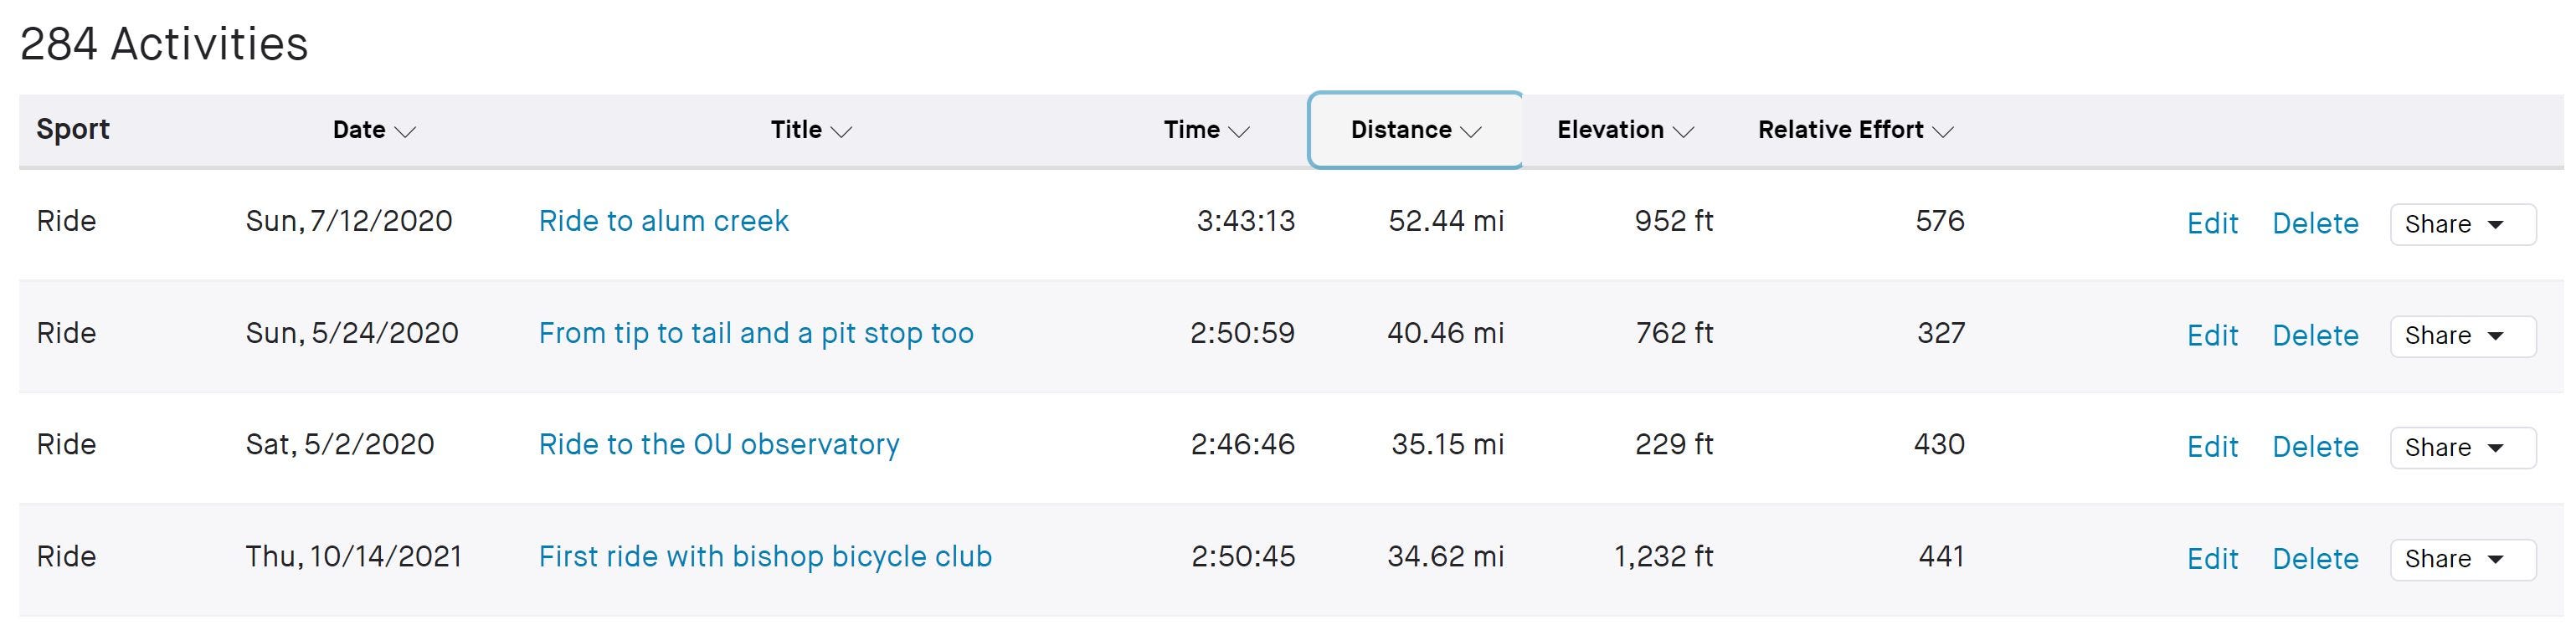
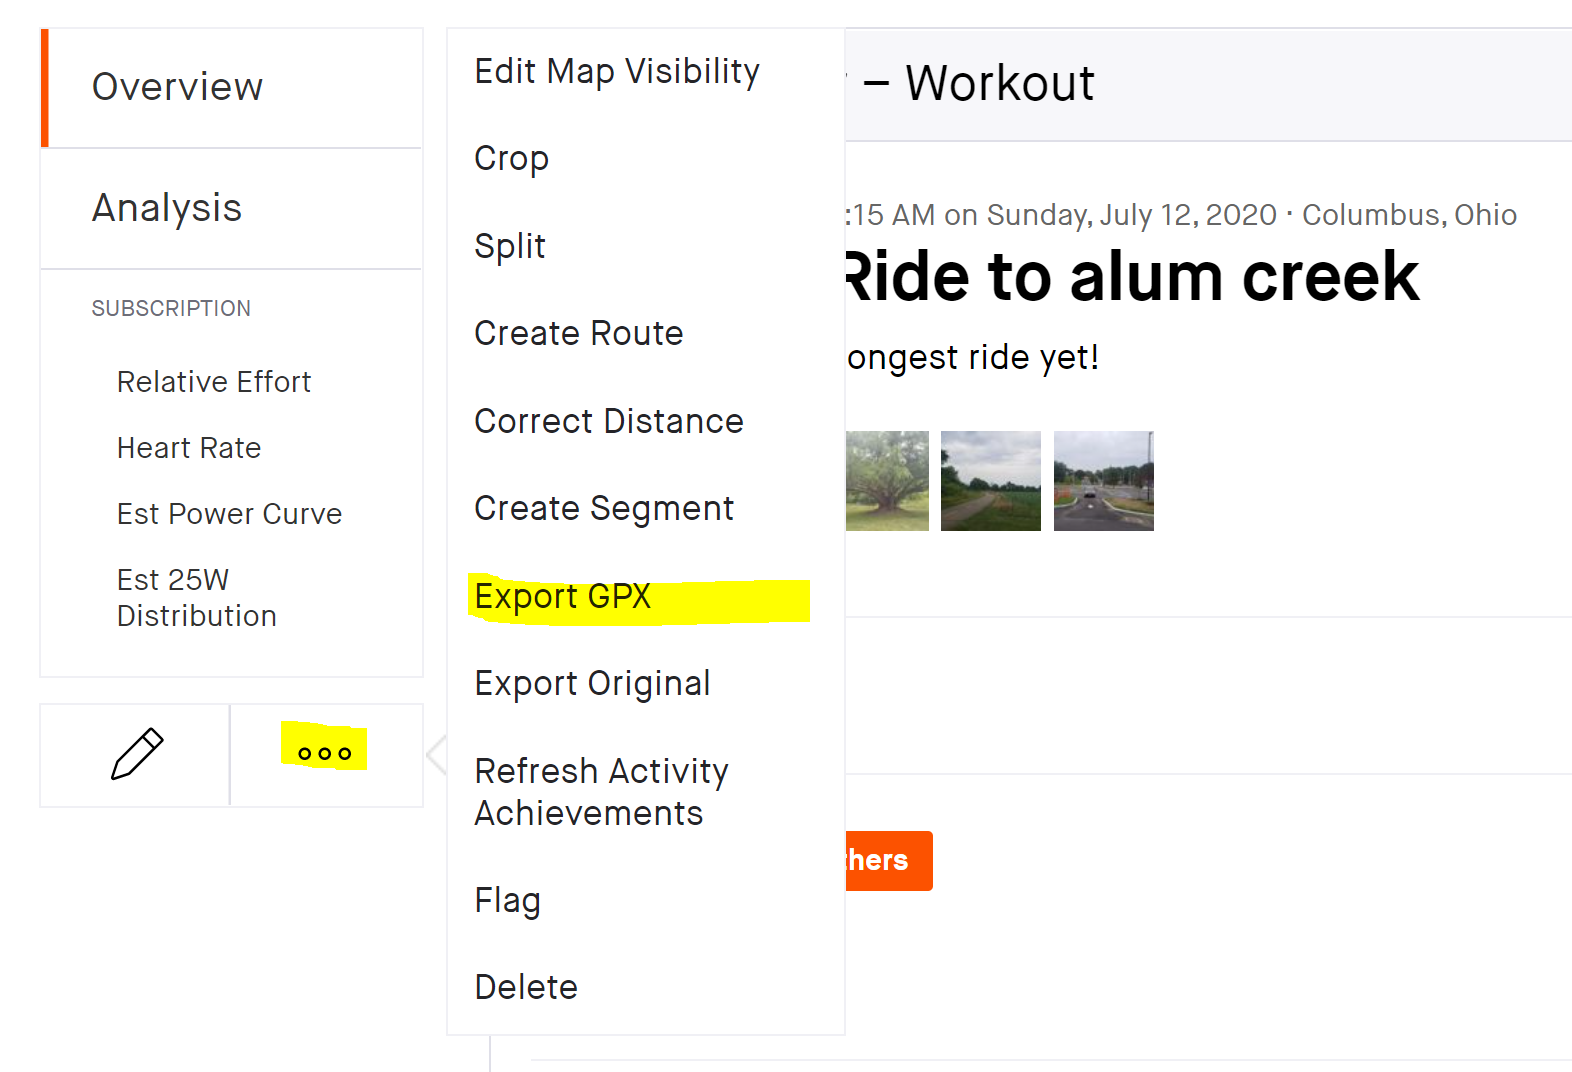
To reach the details page for a ride, just click on the blue title in the list. I chose the "Ride to alum creek" activity. Once the details load, click on the ellipses (…) button and hit "Export GPX" to download your ride’s data.
There are no doubt other ways to download your data from Strava–including its API–but this method works well enough for our current purposes.
The GPX Format Explained
Great, we just downloaded a .gpx file, but what exactly is it? GPX is short for GPS Exchange Format [1]. Let us take a look at the inside of a .gpx file to gain some intuition. An abbreviated version of the file is shown below with a few hierarchical annotations:
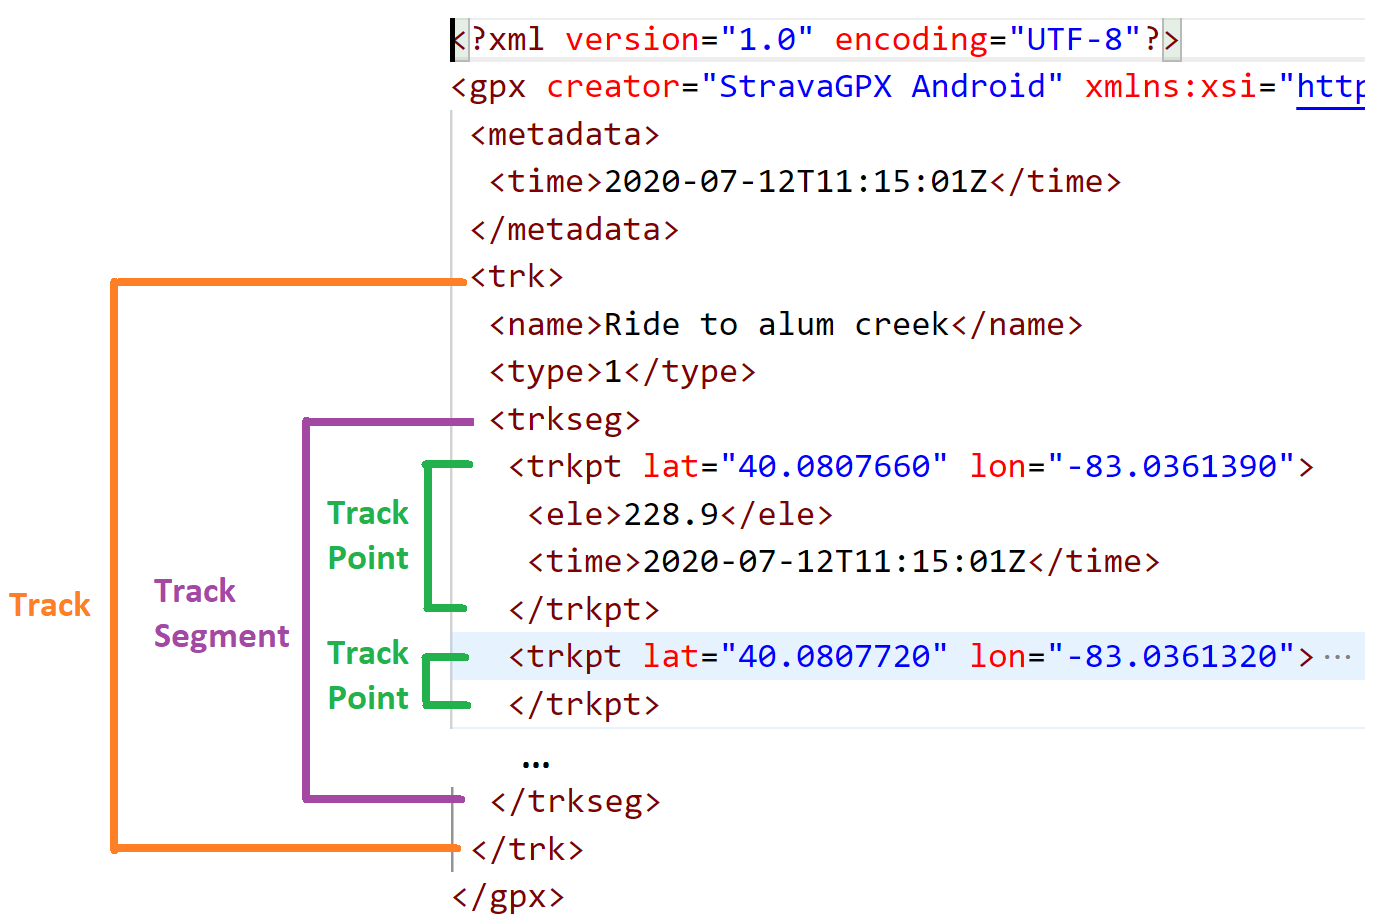
The file is broken up into an XML tree structure with a node as the parent of all other nodes. Besides some metadata sprinkled throughout (trip start time, trip name, etc.), the file is made up of a Track node. A Track contains at least one Track Segment which in turn contains multiple Track Points. Each Track Point contains the chronologically ordered "story" of your bike ride. It also gives GPS coordinates (latitude and longitude) as well as the elevation and timestamp of when you were at that point.
The ride data is modeled in an XML tree, but what does it physically represent? The following cartoon describes a potential physical activity:
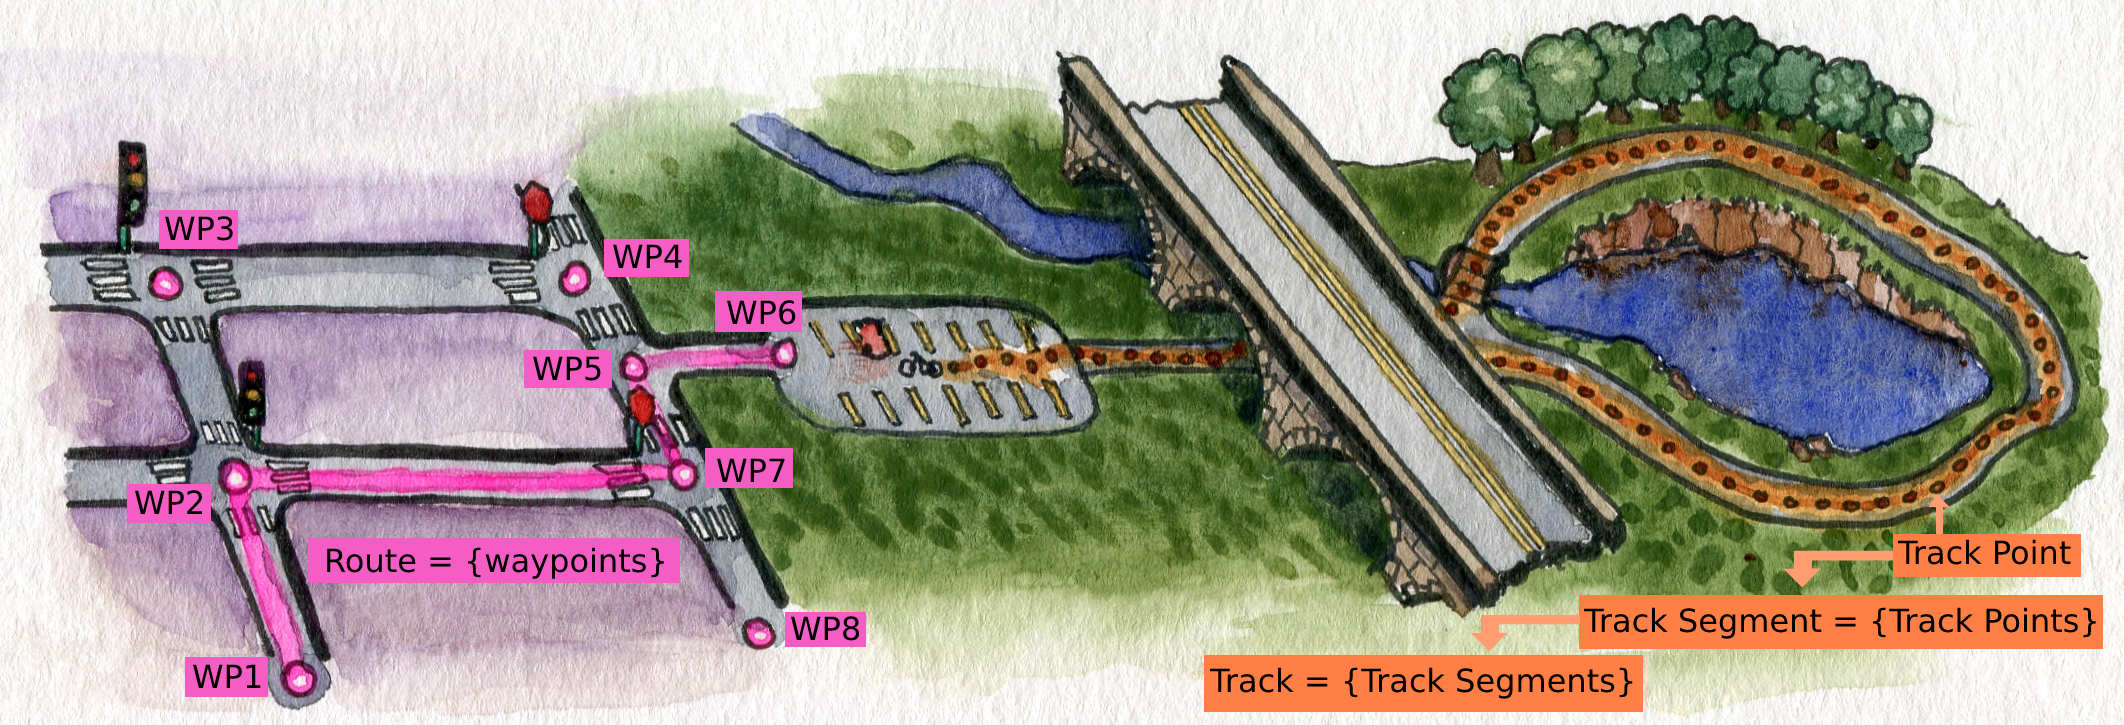
In general, a .gpx file can contain routes and tracks. A route is an unordered collection of waypoints – a pair of GPS coordinates at a minimum – and represents a coarse-grain path from start to destination. A route example is the GPS route plotted by Google Maps to navigate your car to a certain trailhead. There are often multiple waypoint sequences that could be routes you take to the destination, but typically your navigation app will select the best (i.e. shortest) route for you. If you miss a turn, the projected route updates to handle this change [1].
A track is a chronologically ordered set of track points. Unlike the route which contains possible waypoints, a track represents the precise history of points in space and time where you were. It is a fine-grain path that records how you traveled. In the cartoon above, you arrive at a trailhead, unpack your bike and turn on Strava before riding off onto the trail loop. If you were to lose GPS signal by riding under an overpass, your track would continue, but it would be recorded as at least 2 different track segments. A track has at least 1 track segment where each segment contains a collection of continuously recorded track points [1].
How Strava Serves GPX Data
It is worth noting that Strava .gpx files seem to only ever contain 1 track segment. Strava has an auto-pause feature, which stops recording data when you aren’t moving [2]. This is useful for not only conserving phone battery but ultimately representing your bike ride’s moving time and average speed more accurately. According to the definition of a track segment, we would expect multiple segments whenever this happened in the trip. Perhaps, Strava combines these multiple segments into just 1 after uploading.
Converting GPX to CSV with Python 🐍
While downloading ride data is convenient, the .gpx format is less so. For ease of use, we will convert the .gpx structure into the common .csv format. To do so, we need to parse all of the data out of the .gpx and fit it into a tabular Pandas dataframe.
Since the .gpx format is essentially XML, we could use a Python XML library to parse the nodes, but luckily there is a simple, purpose-built alternative called gpxpy. To install the package, use pip install gpxpy or your environment’s relevant package manager. The reference for the package can be found here.
Here is the code to read a .gpx file into a Pandas dataframe:
The data extraction code lives in a with block to act as the context manager for opening and closing the .gpx file. Within this block, the gpxpy package parses the XML tree into a Python object. Extracting the data comes down to looping through all tracks, track segments and track points stored in the object. Store the data of each row in a list of dictionaries before initializing a Pandas dataframe from it.

Saving the data as a .csv is now quite simple: df.to_csv(file_path['out'], index=False).
Conclusion
Starting exercise is not always easy. Motivation can wax and wane, but as a data scientist my curiosity is always thriving. With the Strava app, I have changed my approach to exercise from penal servitude to exciting adventure. The cornerstone of that is being able to create and explore my own fitness dataset. Hopefully this post inspires you to try it with your data and shows you how to collect your own.
I went over how to find and download your exercise data on Strava. It comes in a .gpx format, but I also covered what the format models and how it is structured. Lastly, I shared a code snippet to easily convert the format to .csv using the gpxpy and pandas packages in Python.
Besides the track and segment columns, ride data is actually only 4 other columns. While it might not seem like a lot to work with, my next post will discuss how to create an EDA strategy for this data. There is a lot more to explore than you might think!
[1] hikearizona, GPS File – GPX Explained (2015), YouTube
[2] Jojo, Auto-Pause (2021), Strava.com


