PinnedMike Bostock@mbostockSep 10, 2025Observable Notebook Kit and Desktop 1.3.0 are out, featuring data loader cells. You can now (finally!!) write Python and Node.js in notebooks. 🐍 observablehq.com/notebook-kit/d…2266525211K11K
Mike Bostock@mbostockMay 2, 2023Updated my plot of bank failures. 😬 observablehq.com/@mbostock/bank…4174173K3K15K15K2.9M2.9M
Mike Bostock@mbostockFeb 23, 2021It’s been ten years since I pushed the first release of D3.js to GitHub. Have I learned anything? I hope so… but it’s a journey. 10 Years of Open-Source VisualizationFrom observablehq.com39394174172.2K2.2K
Mike Bostock@mbostockJun 28, 2016After 12+ months and ~4,878 commits, I am excited to announce the release of D3 4.0! github.com/d3/d3/releases… 📊📈🎉 #d3jsRelease v4.0.0 · d3/d3From github.com57571.1K1.1K1.7K1.7K
Mike Bostock@mbostockMay 4, 2021Announcing a new open-source JavaScript library for exploratory data visualization: Observable Plot! Observable PlotFrom observablehq.com12122962961.3K1.3K
Mike Bostock@mbostockMay 4, 2015I’m leaving @nytgraphics to work full-time on visualization tools! 💥1221224464461.2K1.2K
Mike Bostock@mbostockApr 28, 2017Introducing d3.express: the integrated discovery environment. A Better Way to CodeFrom medium.com2828518518999999
Mike Bostock@mbostockMay 2, 2018Don’t compare percentage change on a linear scale; use a log scale instead. -50% (0.5×) is as big a change as +100% (2×).1717232232969969
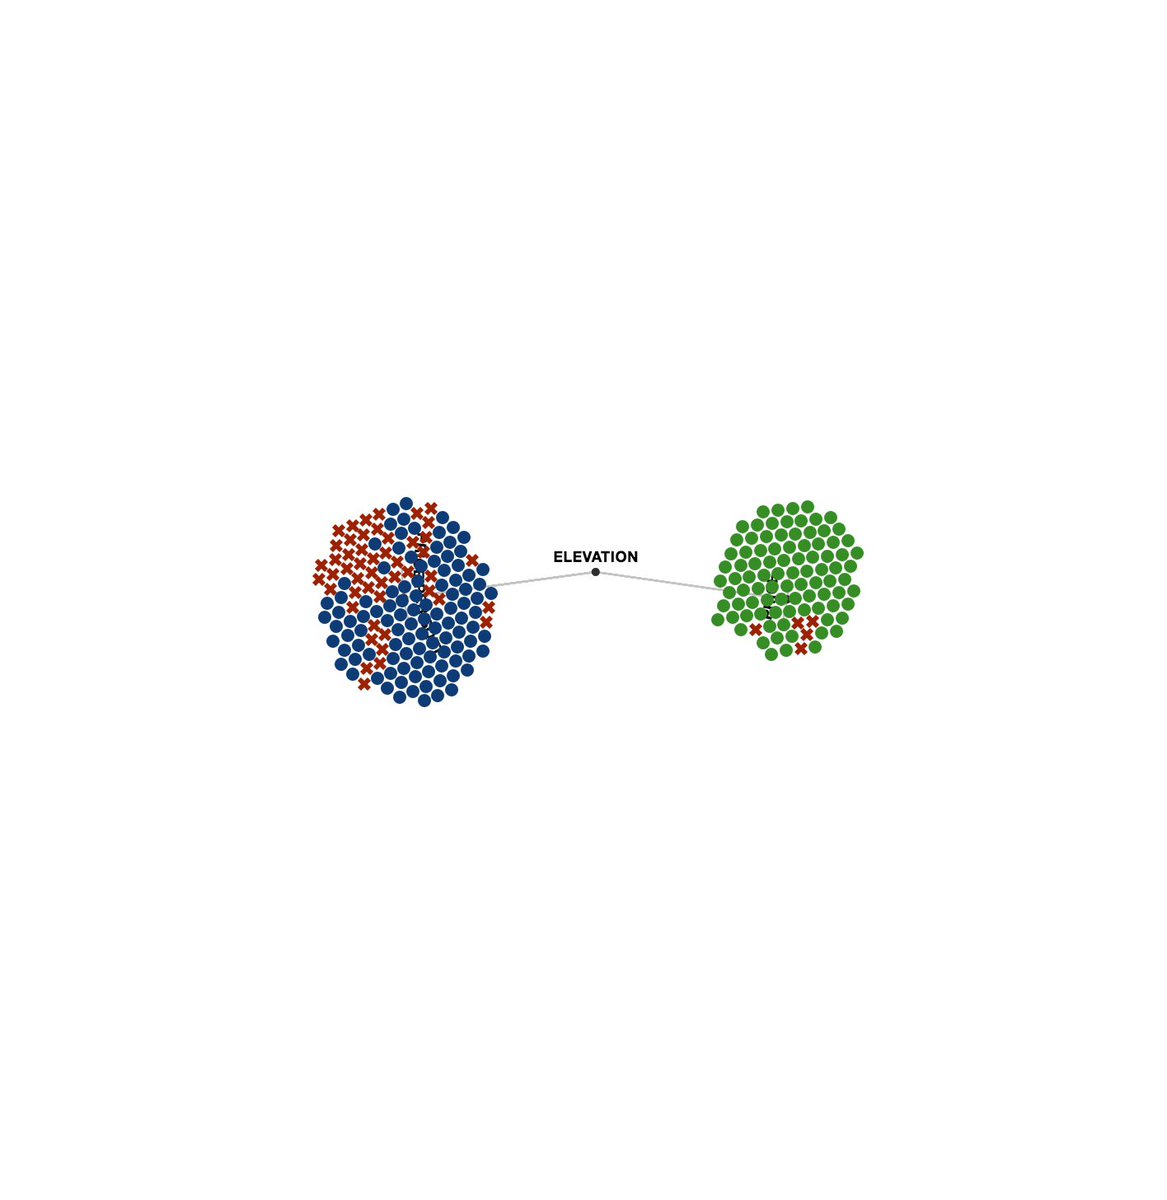
Mike Bostock@mbostockJun 18, 2018Lovely animation of hierarchical clustering by @r2d3us! r2d3.us/visual-intro-t…GIF1010304304962962
Mike Bostock@mbostockMar 22, 2018D3 5.0 is out! 🎉 Here’s a summary of what’s new: d3/CHANGES.md at main · d3/d3From github.com1212371371908908
Mike Bostock@mbostockJan 28, 2018D3 5.0 prerelease! 🎉 Adds contours, density estimation, ColorBrewer color schemes and adopts Fetch for loading data. Release v5.0.0-rc.1 · d3/d3From github.com55271271788788
Mike Bostock@mbostockJun 8, 2017Hours of daylight as a function of latitude and day of year.1414297297739739
Mike Bostock@mbostockDec 17, 2018Yes, you should use D3. Why you should use D3From medium.com1616167167754754