ML system design interviews test how well you can think beyond models. In these interviews, choosing an algorithm is only one part of the answer. You also need to explain how data is collected, how features are created, how predictions are served, and how the system improves over time.
Most real ML systems are built around product decisions. A feed system decides what to show. A fraud system decides what to block. A search system decides what to rank. This article walks through 10 such problems in a practical interview style.
Table of contents
- How to Think in an ML System Design Interview
- Feed Ranking System
- Ads CTR Prediction System
- E-commerce Search Ranking System
- Fraud Detection System
- ETA Prediction System
- Spam and Phishing Detection System
- Visual Defect Detection System
- Demand Forecasting System
- Dynamic Pricing System
- RAG-Based Customer Support Assistant
- Final Interview Checklist
How to Think in an ML System Design Interview
Start with the product goal. Every ML system is built to make a decision. A feed system decides which post to show. A fraud system decides whether a payment is risky. A search system decides which products should appear first.
Once the goal is clear, define success. Do not only talk about model metrics. A good ML system design answer should cover three types of metrics:
- Model metrics: accuracy, AUC, RMSE, precision, recall, NDCG
- Product metrics: revenue, retention, conversion, fraud loss, user satisfaction
- System metrics: latency, throughput, availability, freshness, cost
Next, discuss the data. Explain what data is collected, how labels are created, and where bias can enter. Some labels are quick, like clicks. Some labels are delayed, like chargebacks, complaints, or product returns.
Then split the system into three views: offline path, online path, and feedback loop.
Offline Path
The offline path is used to prepare data and train the model. It usually runs in batches. It focuses on quality, correctness, and repeatability.
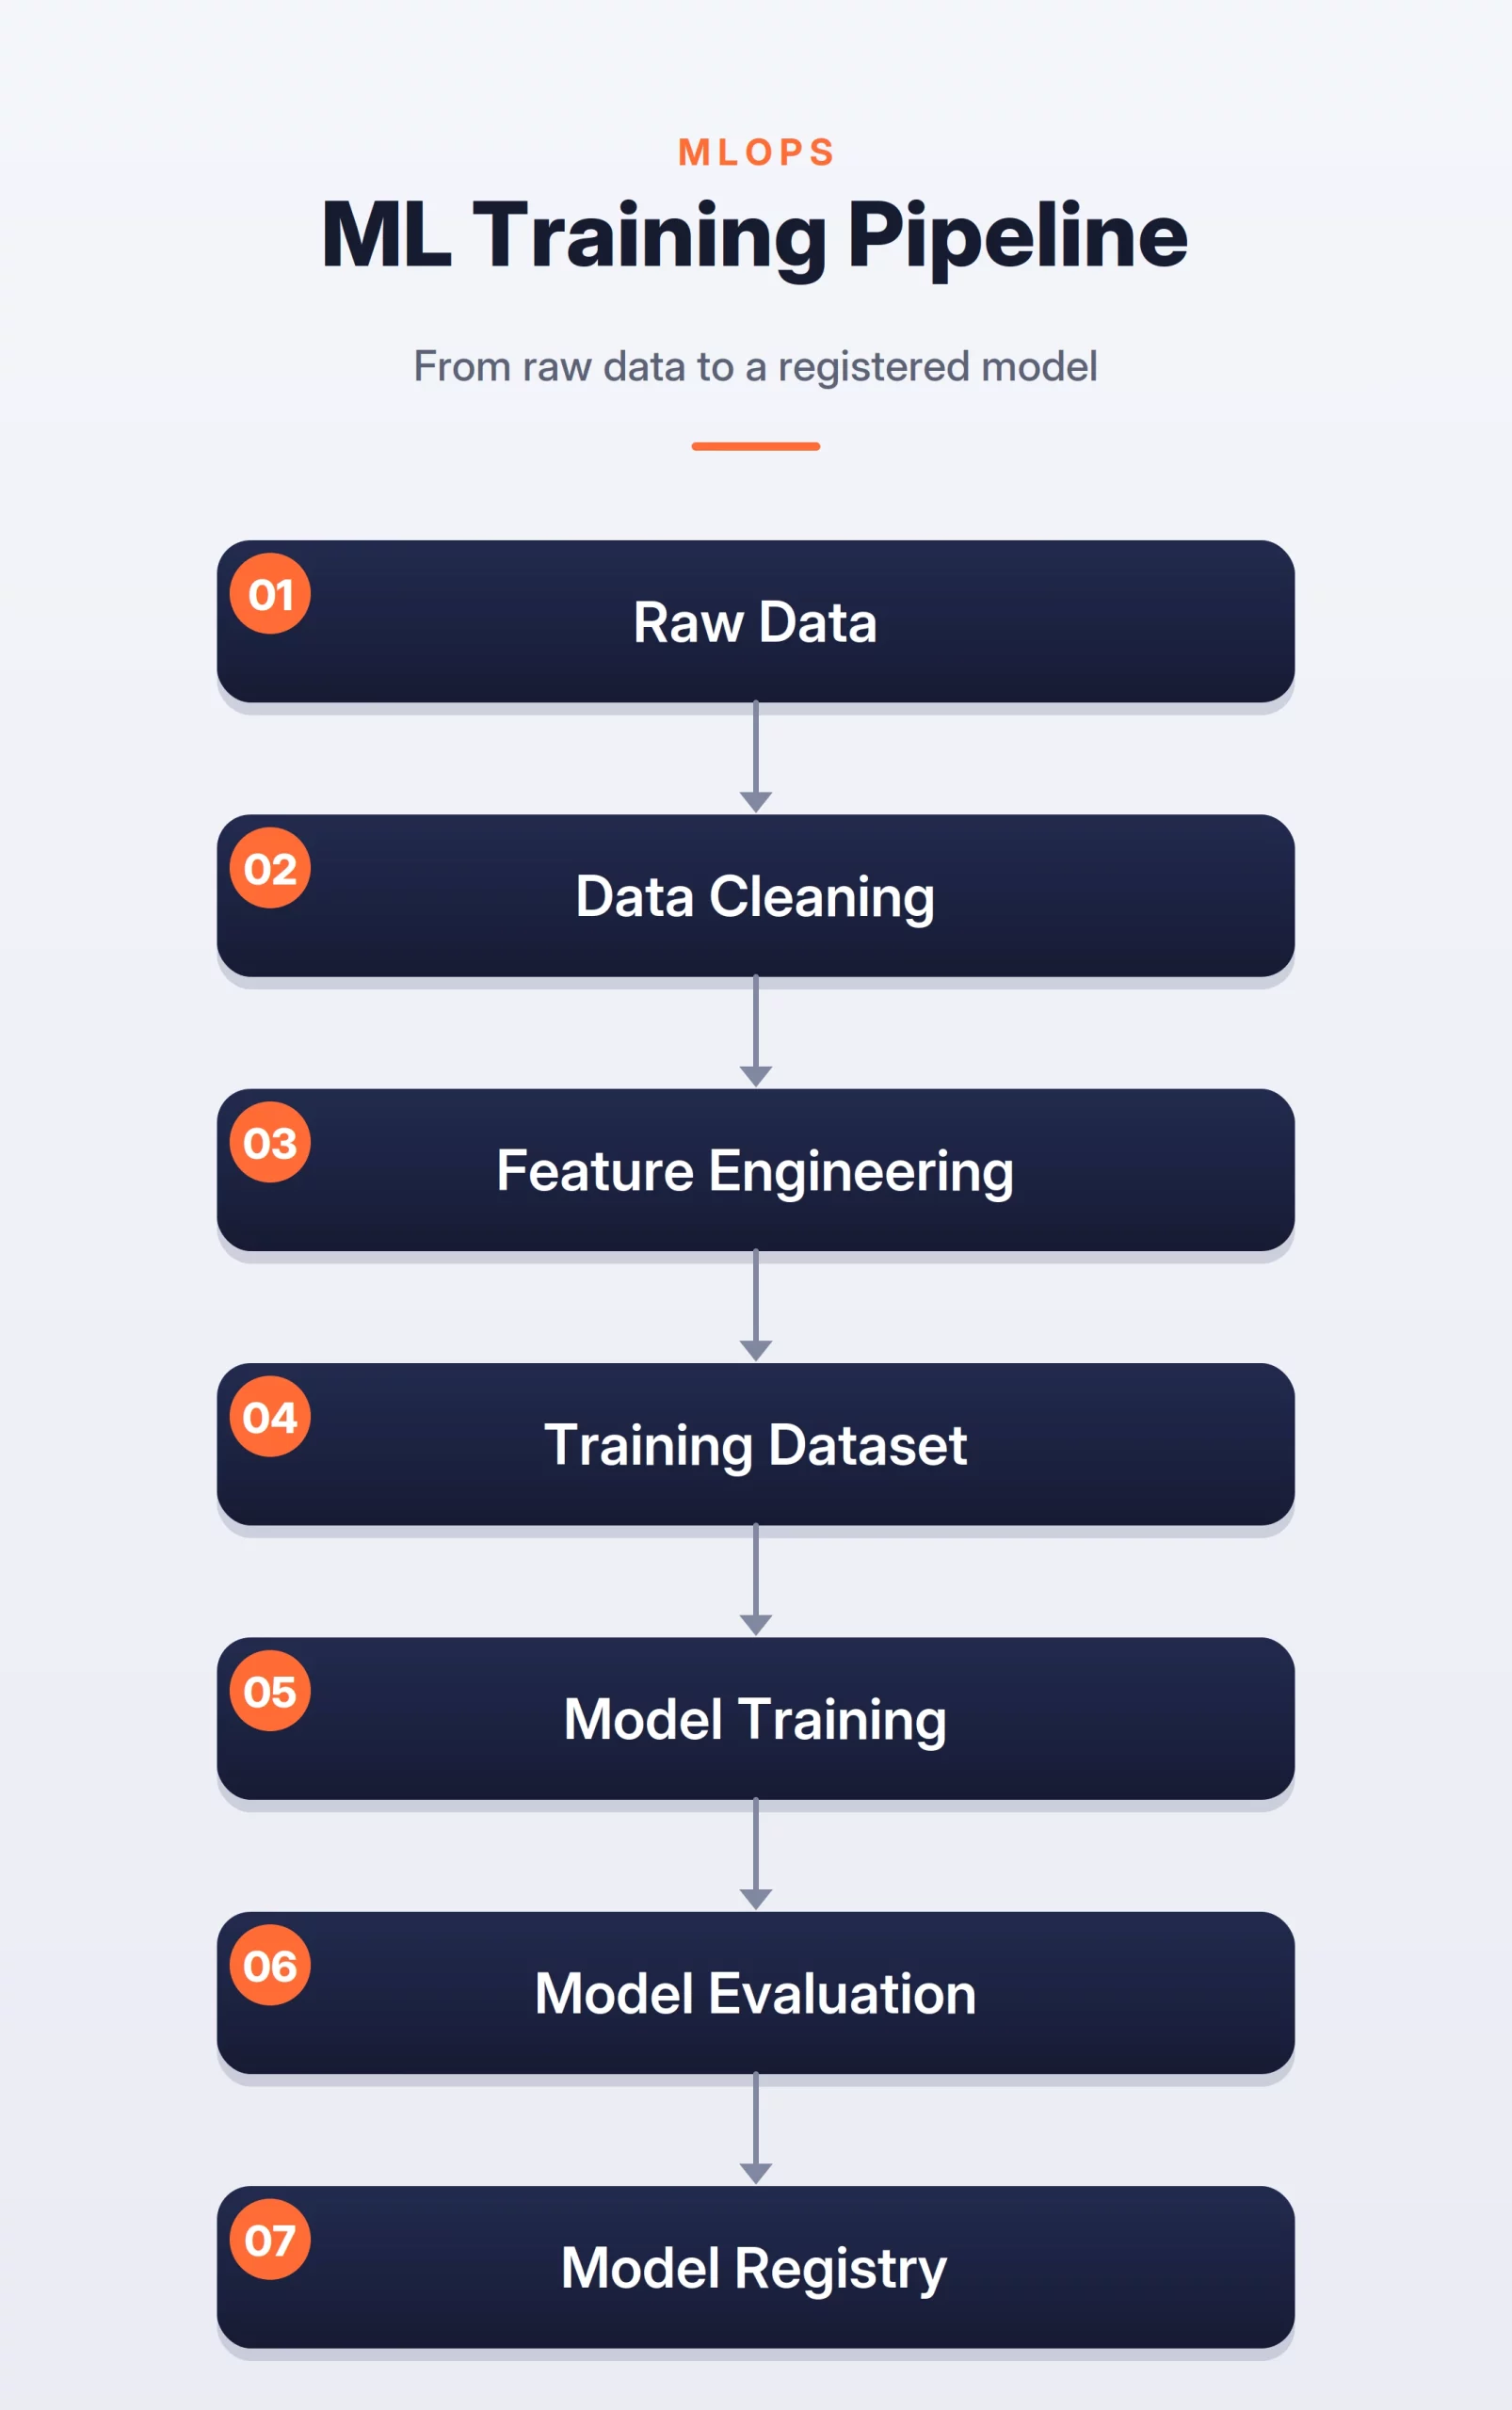
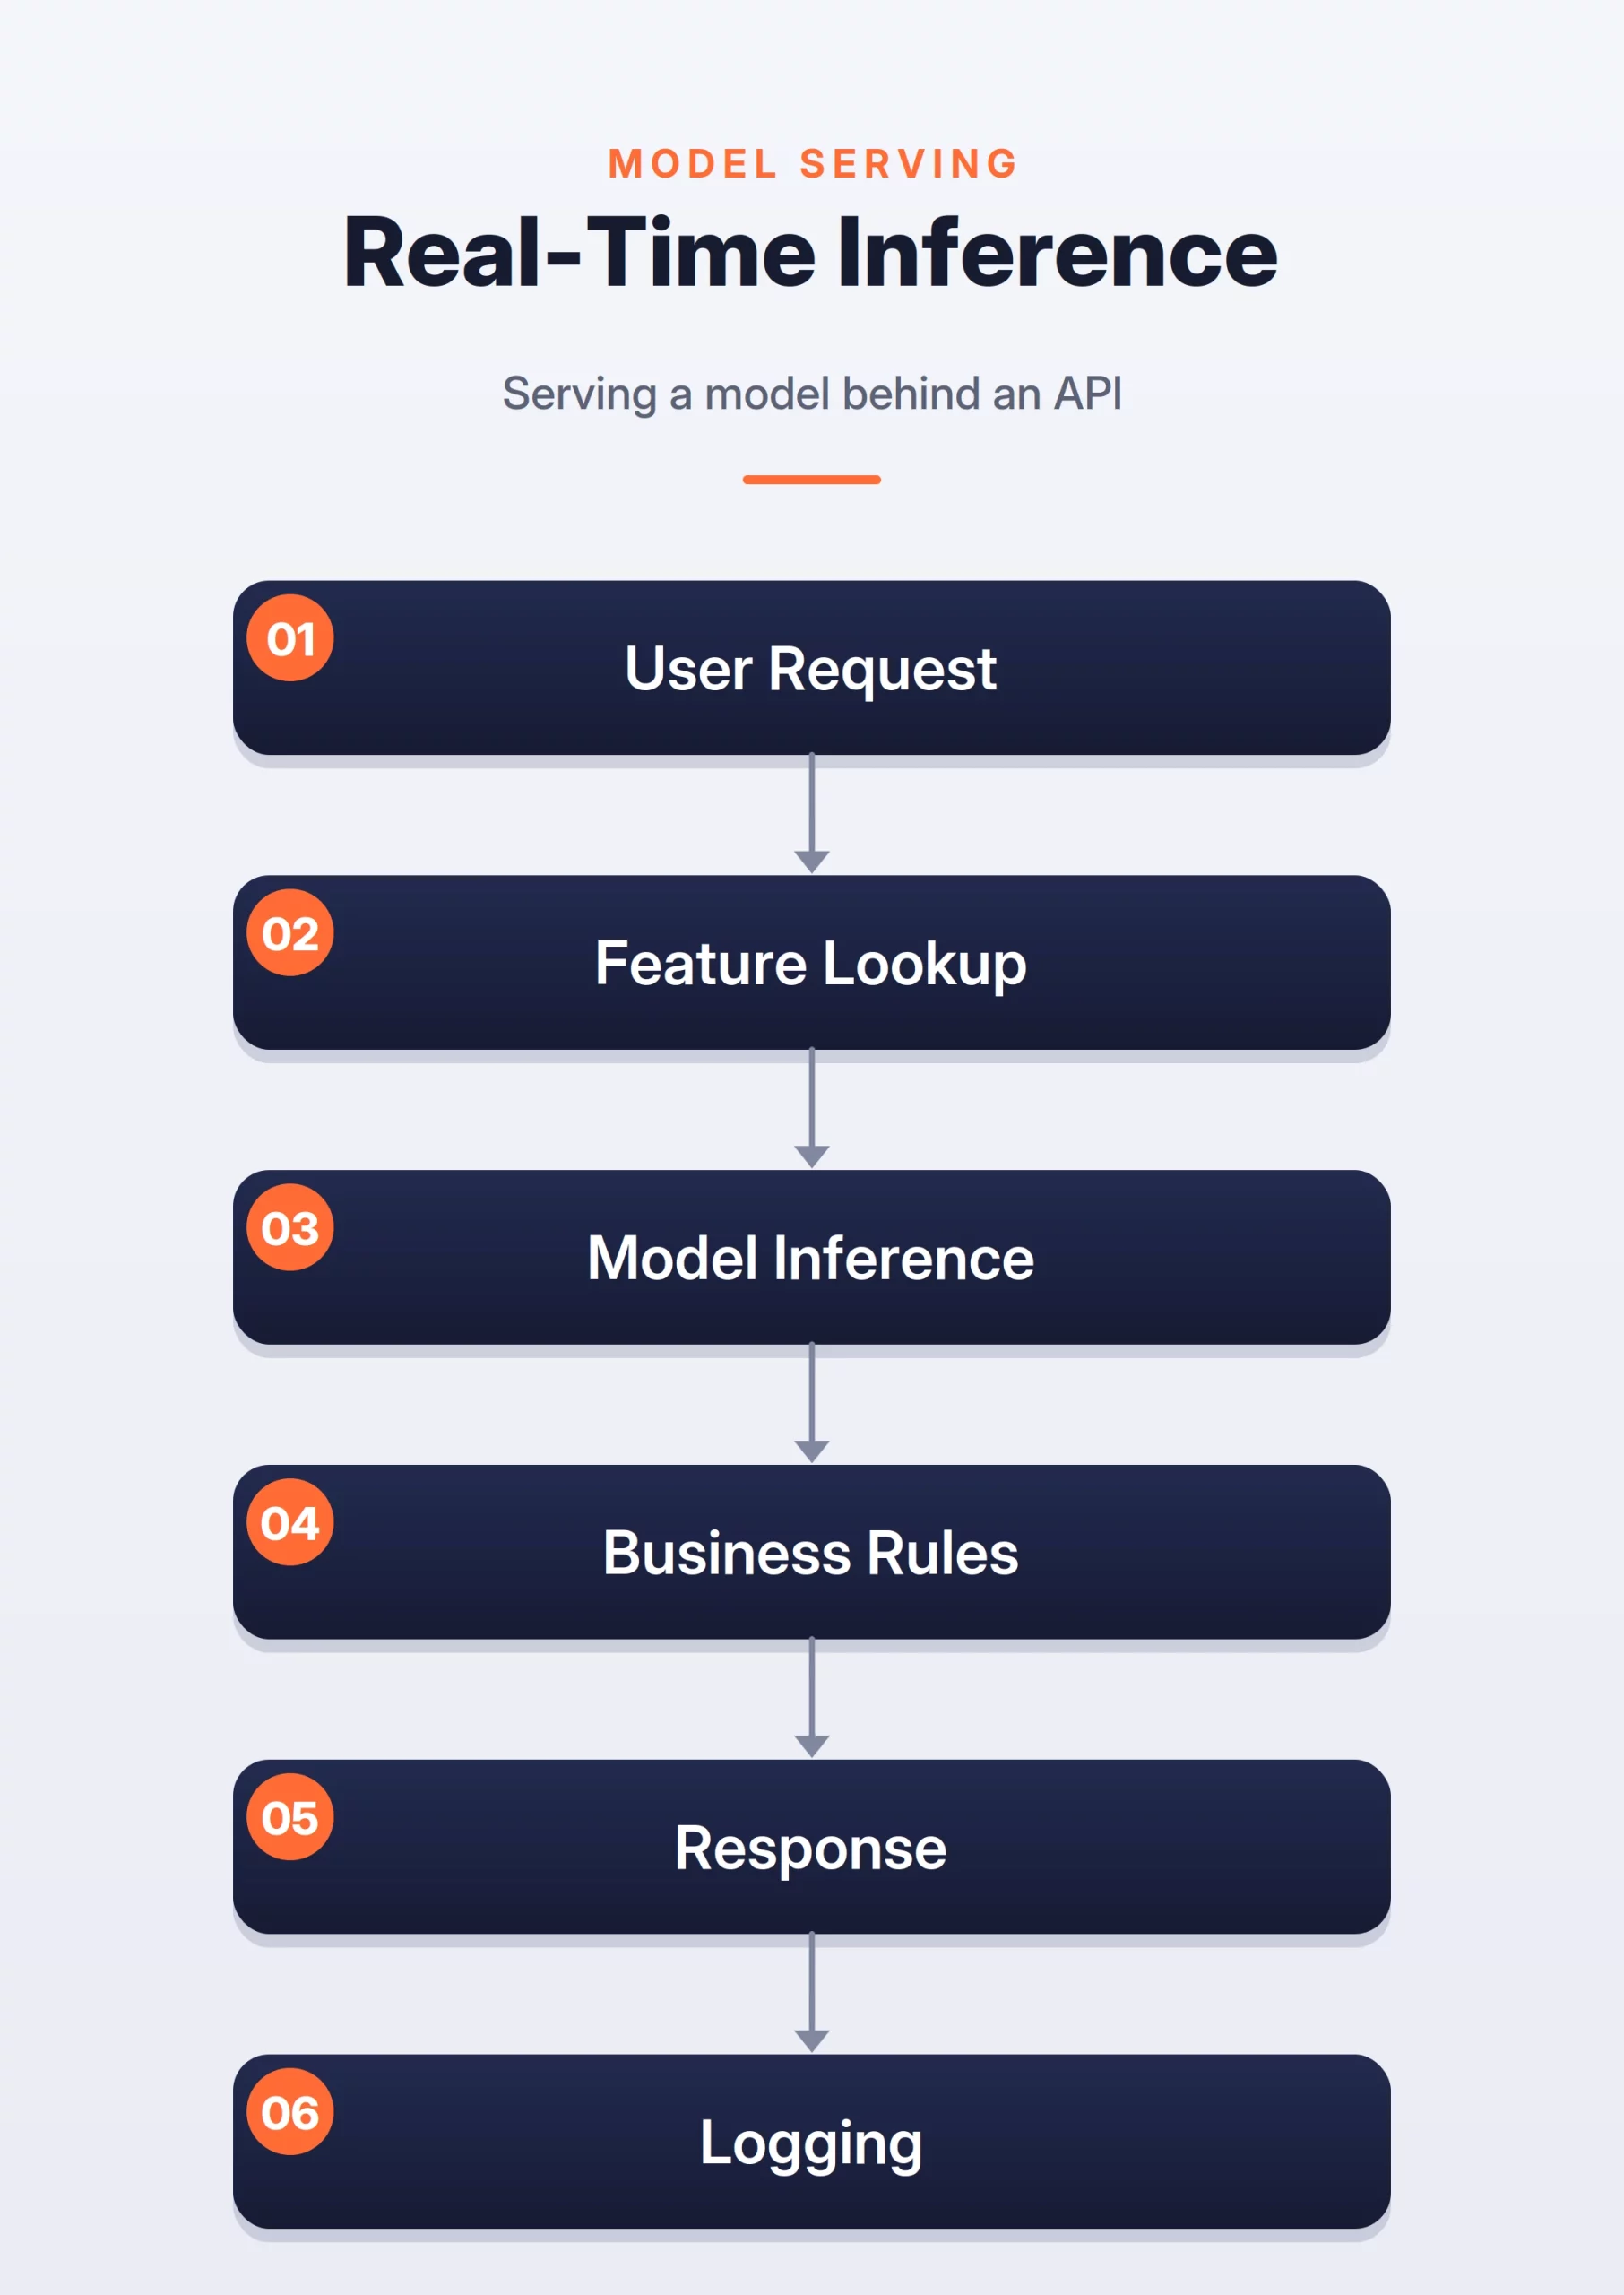
Online Path
The online path is used to serve predictions. It must be fast and reliable because the user is waiting for the result.
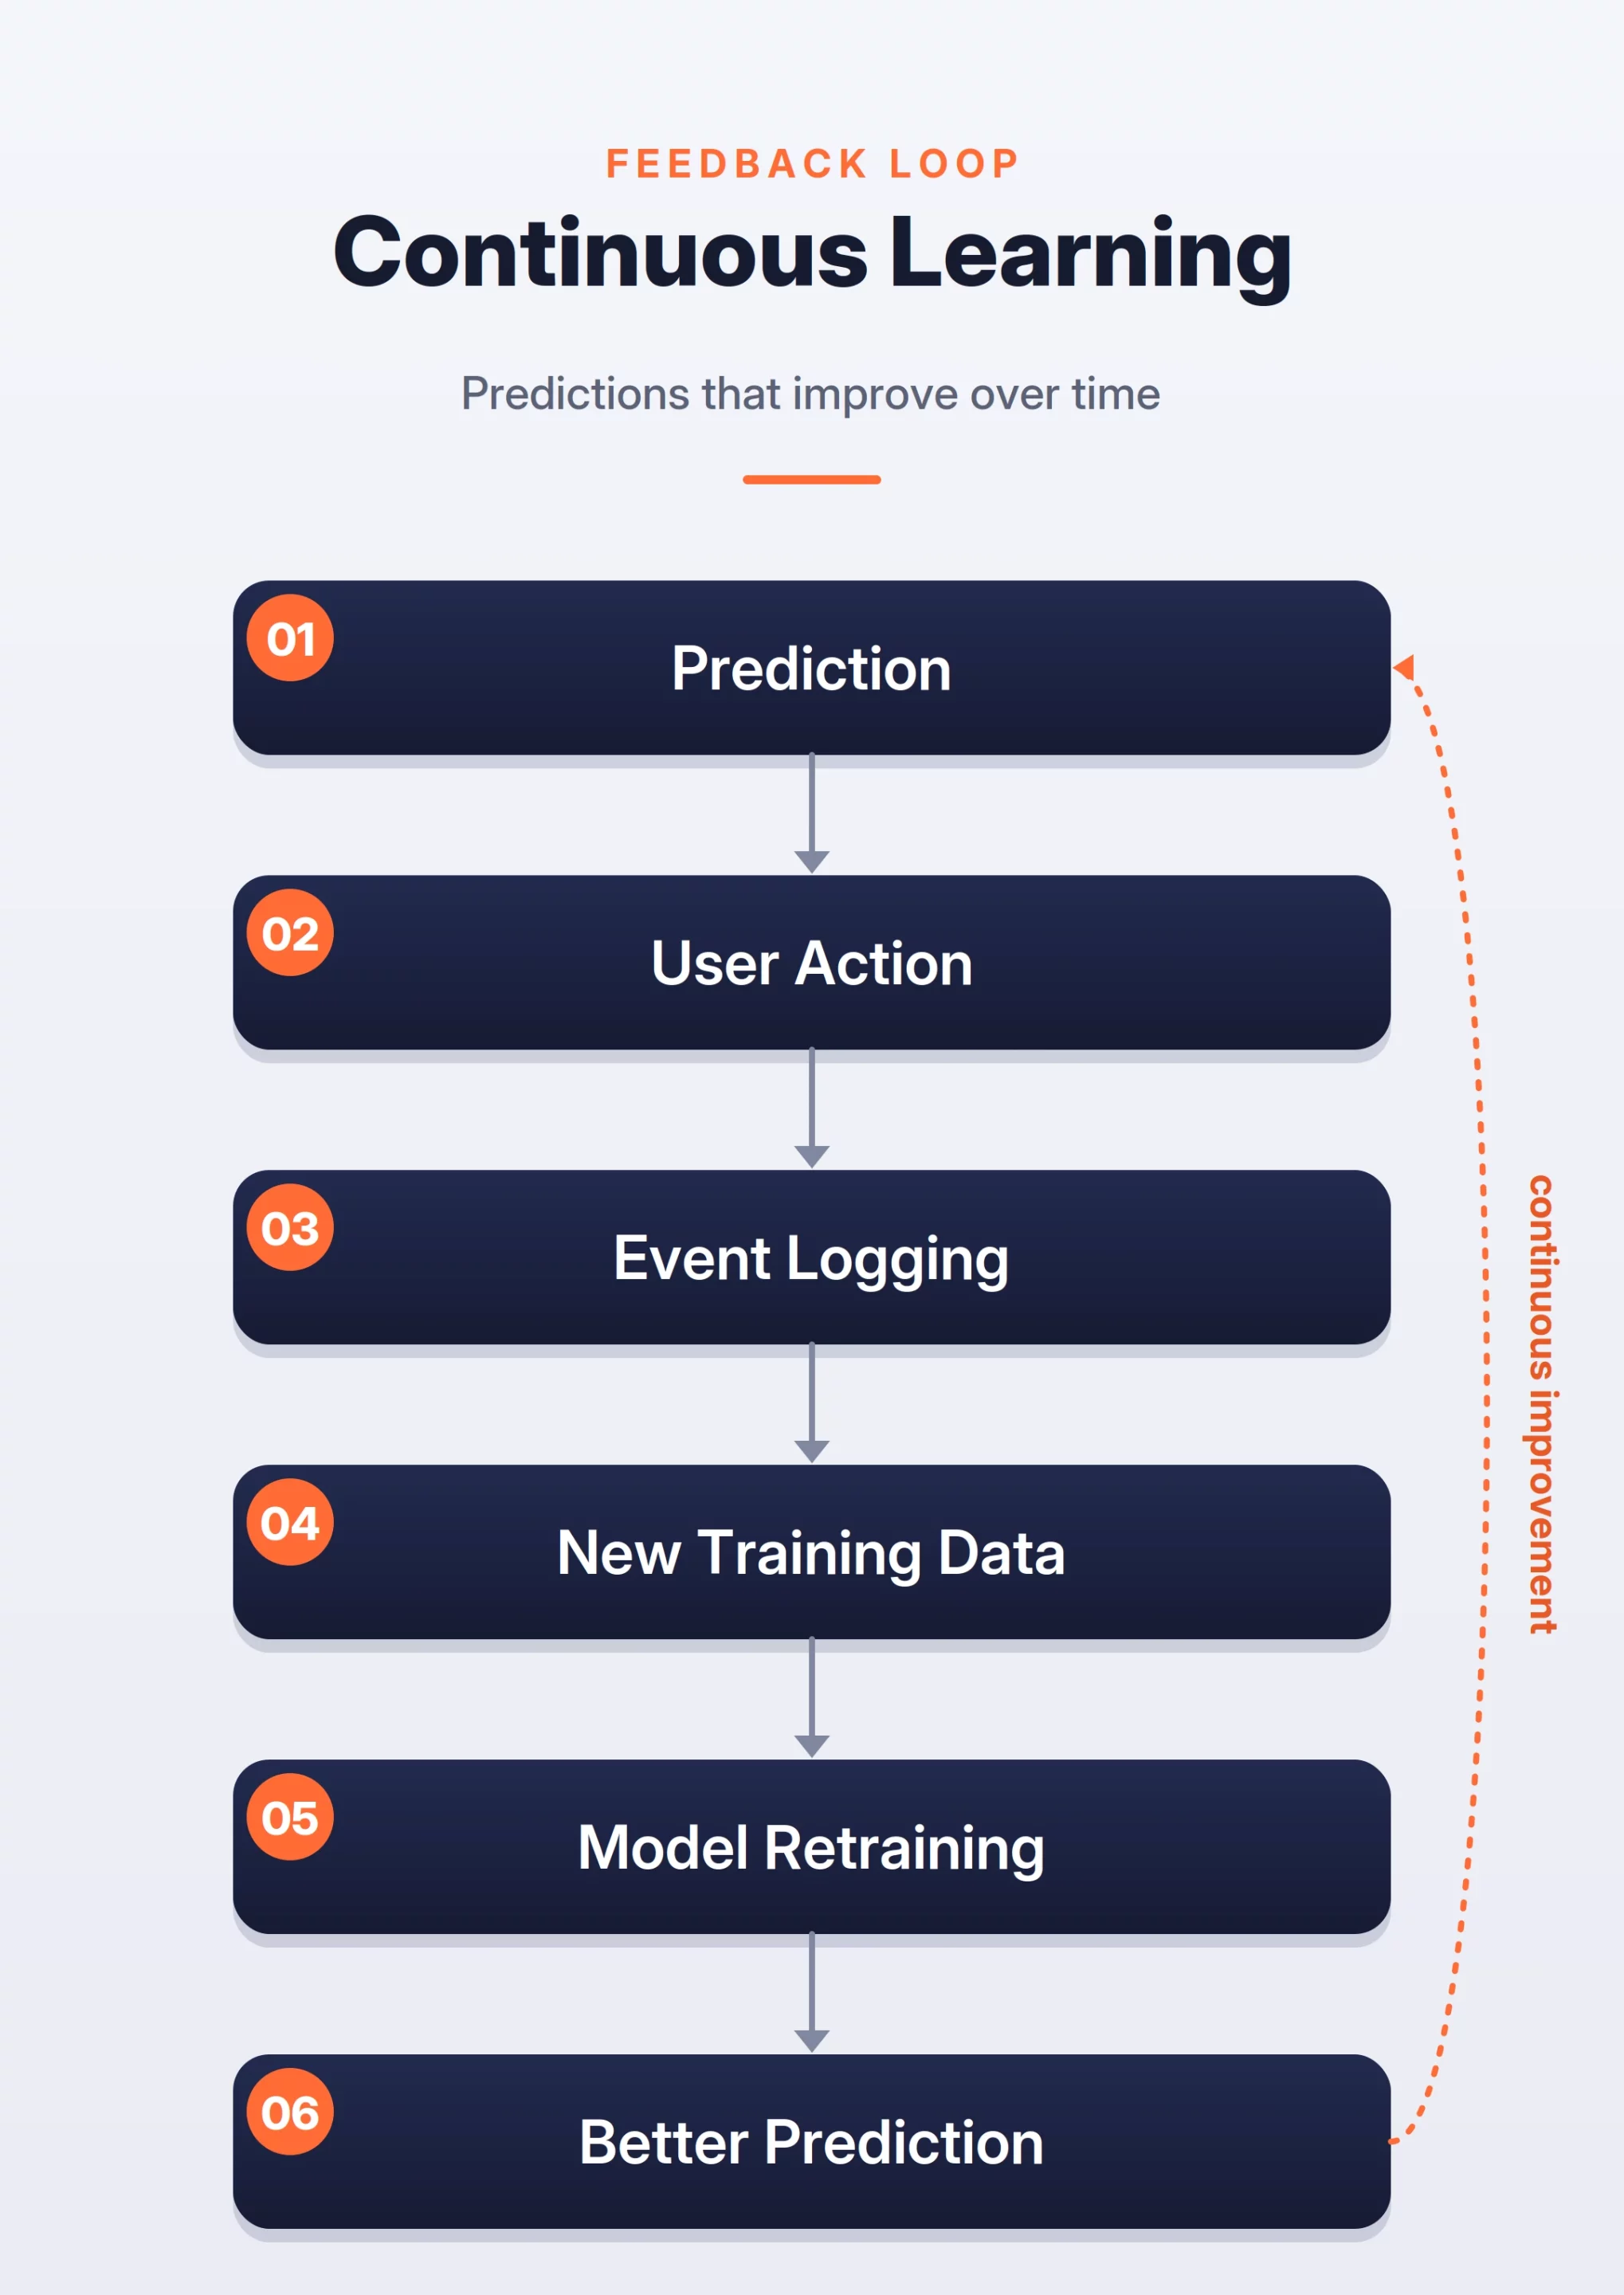
ML System Feedback Loop
The feedback loop connects online behavior back to training. This is how the system improves over time.
These three diagrams cover the core structure of most ML systems. In an interview, they help you explain the system clearly without jumping directly into algorithms.
1. Feed Ranking System
A feed ranking system decides what a user should see next across social media, short video, news, or networking platforms.
While it may seem like a simple ranking problem, production systems deal with millions of possible posts and can show only a few. So instead of scoring every post, the system first narrows the candidate set, then uses a stronger model to rank the best options.
Problem Statement
Design a personalized feed ranking system. Given a user and a large pool of posts, return a ranked list of posts that the user is likely to find useful or engaging.
The system should handle freshness, personalization, safety, diversity, and low latency.
How the System Works
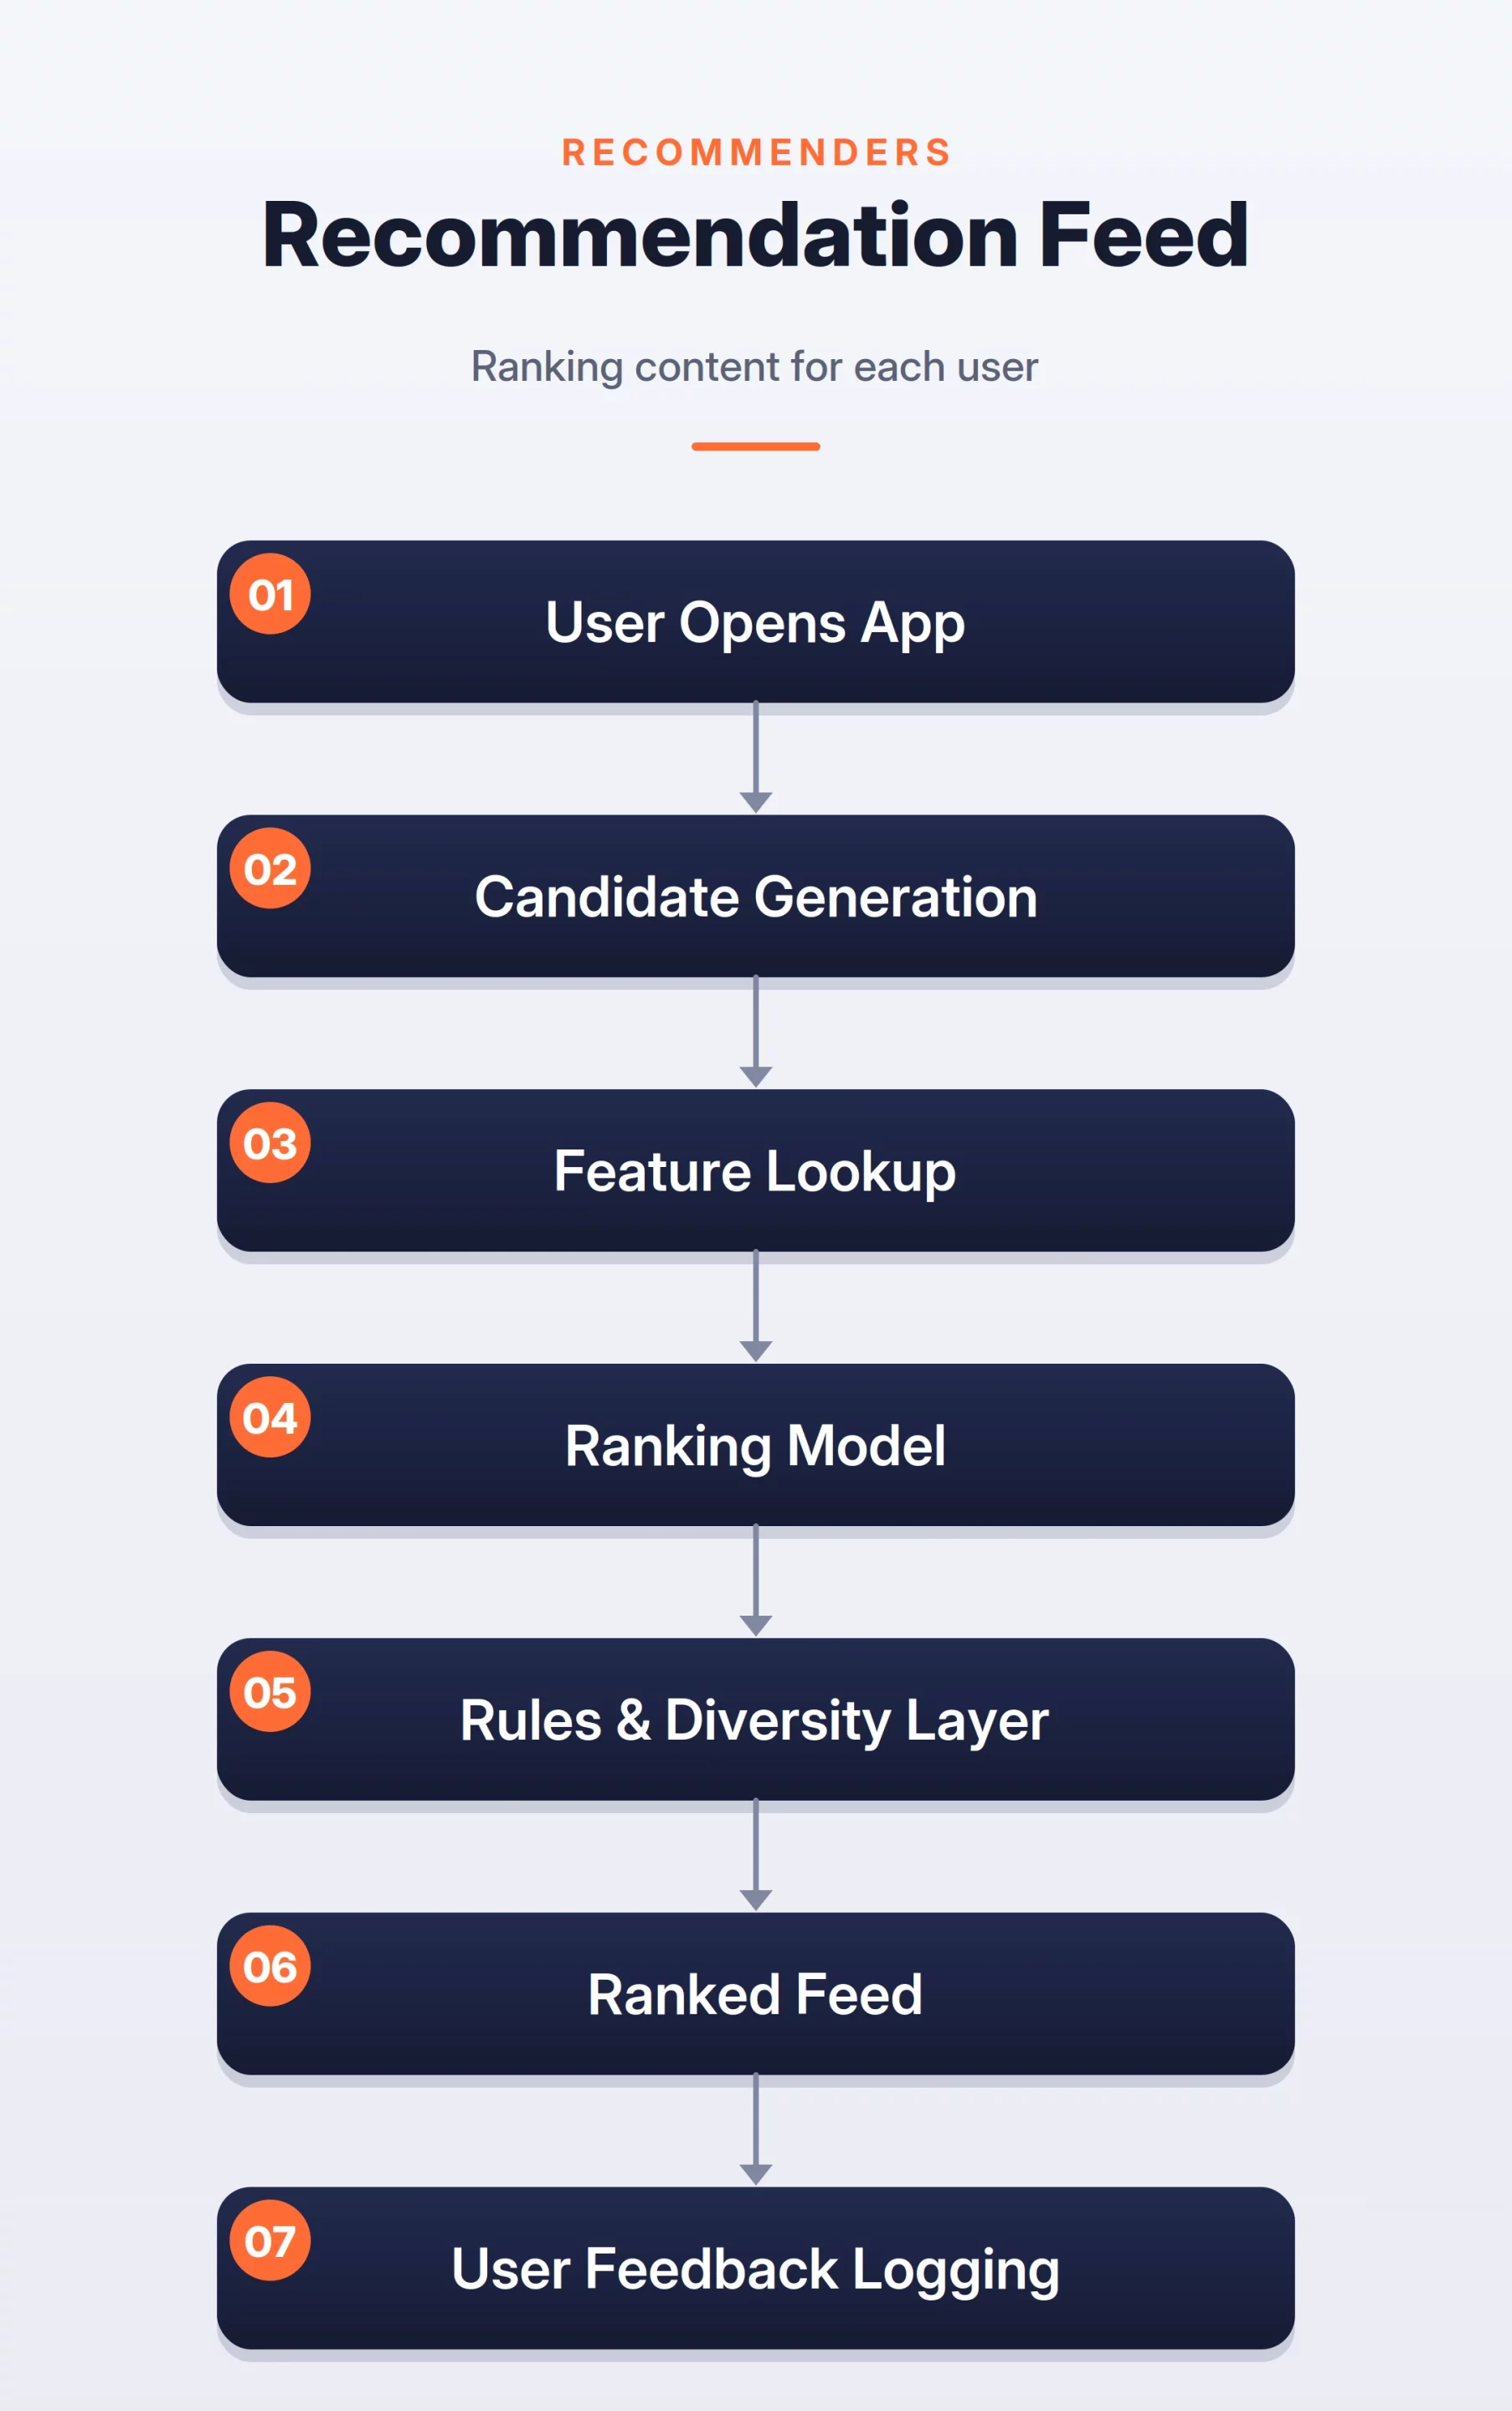
The system usually works in three stages.
- Candidate generation selects a smaller set of posts. These posts can come from people the user follows, topics the user likes, trending content, similar users, or embedding-based retrieval.
- The ranking model scores each candidate. The score can be based on predicted clicks, likes, comments, shares, watch time, skips, or hides. In a real system, the final score is often a weighted mix of many predicted actions.
- A rules layer adjusts the ranked list. It removes unsafe content, avoids duplicates, improves diversity, and prevents the feed from showing too many posts from the same creator.
Feed Ranking Flow
Important Signals
The model needs signals about the user, the post, and the interaction between them.
Useful signals include:
- User interests and past behavior
- Creator affinity
- Post freshness
- Post engagement rate
- Content category
These signals help the model understand both long-term preferences and short-term intent. For example, a user may usually like machine learning content, but in the current session they may be watching more career-related posts.
Model Choice
A good first version can use a gradient boosted tree model. It works well with tabular features and is easier to debug than a complex deep model.
As the system grows, candidate generation can use embeddings. The ranking model can also become more advanced. It can use deep learning models, sequence models, or multi-task models that predict multiple actions at once.
The important point is to start simple. A strong baseline with good logging is more useful than a complex model that is hard to monitor.
Evaluation Metrics
Offline evaluation can use AUC, NDCG, precision@K, and recall@K. These metrics show whether the model can rank relevant posts higher.
Online evaluation is more important. The system should track click-through rate, dwell time, session length, hide rate, retention, and content diversity.
A feed system should not optimize only for clicks. Clickbait content may increase short-term engagement but harm long-term user satisfaction.
Trade-offs
The biggest trade-off is relevance versus exploration. If the system only shows content similar to past clicks, the feed becomes repetitive. If it explores too much, the user may see irrelevant posts.
There is also a trade-off between freshness and quality. New posts may not have enough engagement data yet. But if the system ignores new posts, users may miss timely content.
Latency is another concern. The system must return the feed quickly. Candidate generation, feature lookup, and ranking should all be optimized for fast response.
Interview Tip
In an interview, always mention that the system cannot score every post online. A good feed system first generates candidates, then ranks them, and finally applies business rules.
This shows that you understand both ML and system scalability.
2. Ads CTR Prediction System
An ads CTR prediction system estimates how likely a user is to click an ad and uses that score to decide which ad to show.
Unlike normal content ranking, it must balance three goals: user relevance, advertiser returns, and platform revenue. So the objective is not just more clicks, but showing ads that are relevant, safe, and useful.
Problem Statement
Design a system that predicts the click-through rate of ads in real time. The system should use this prediction with advertiser bids, budgets, and auction rules to select the best ad for a user.
It should also respect targeting rules, policy checks, frequency caps, and campaign budgets.
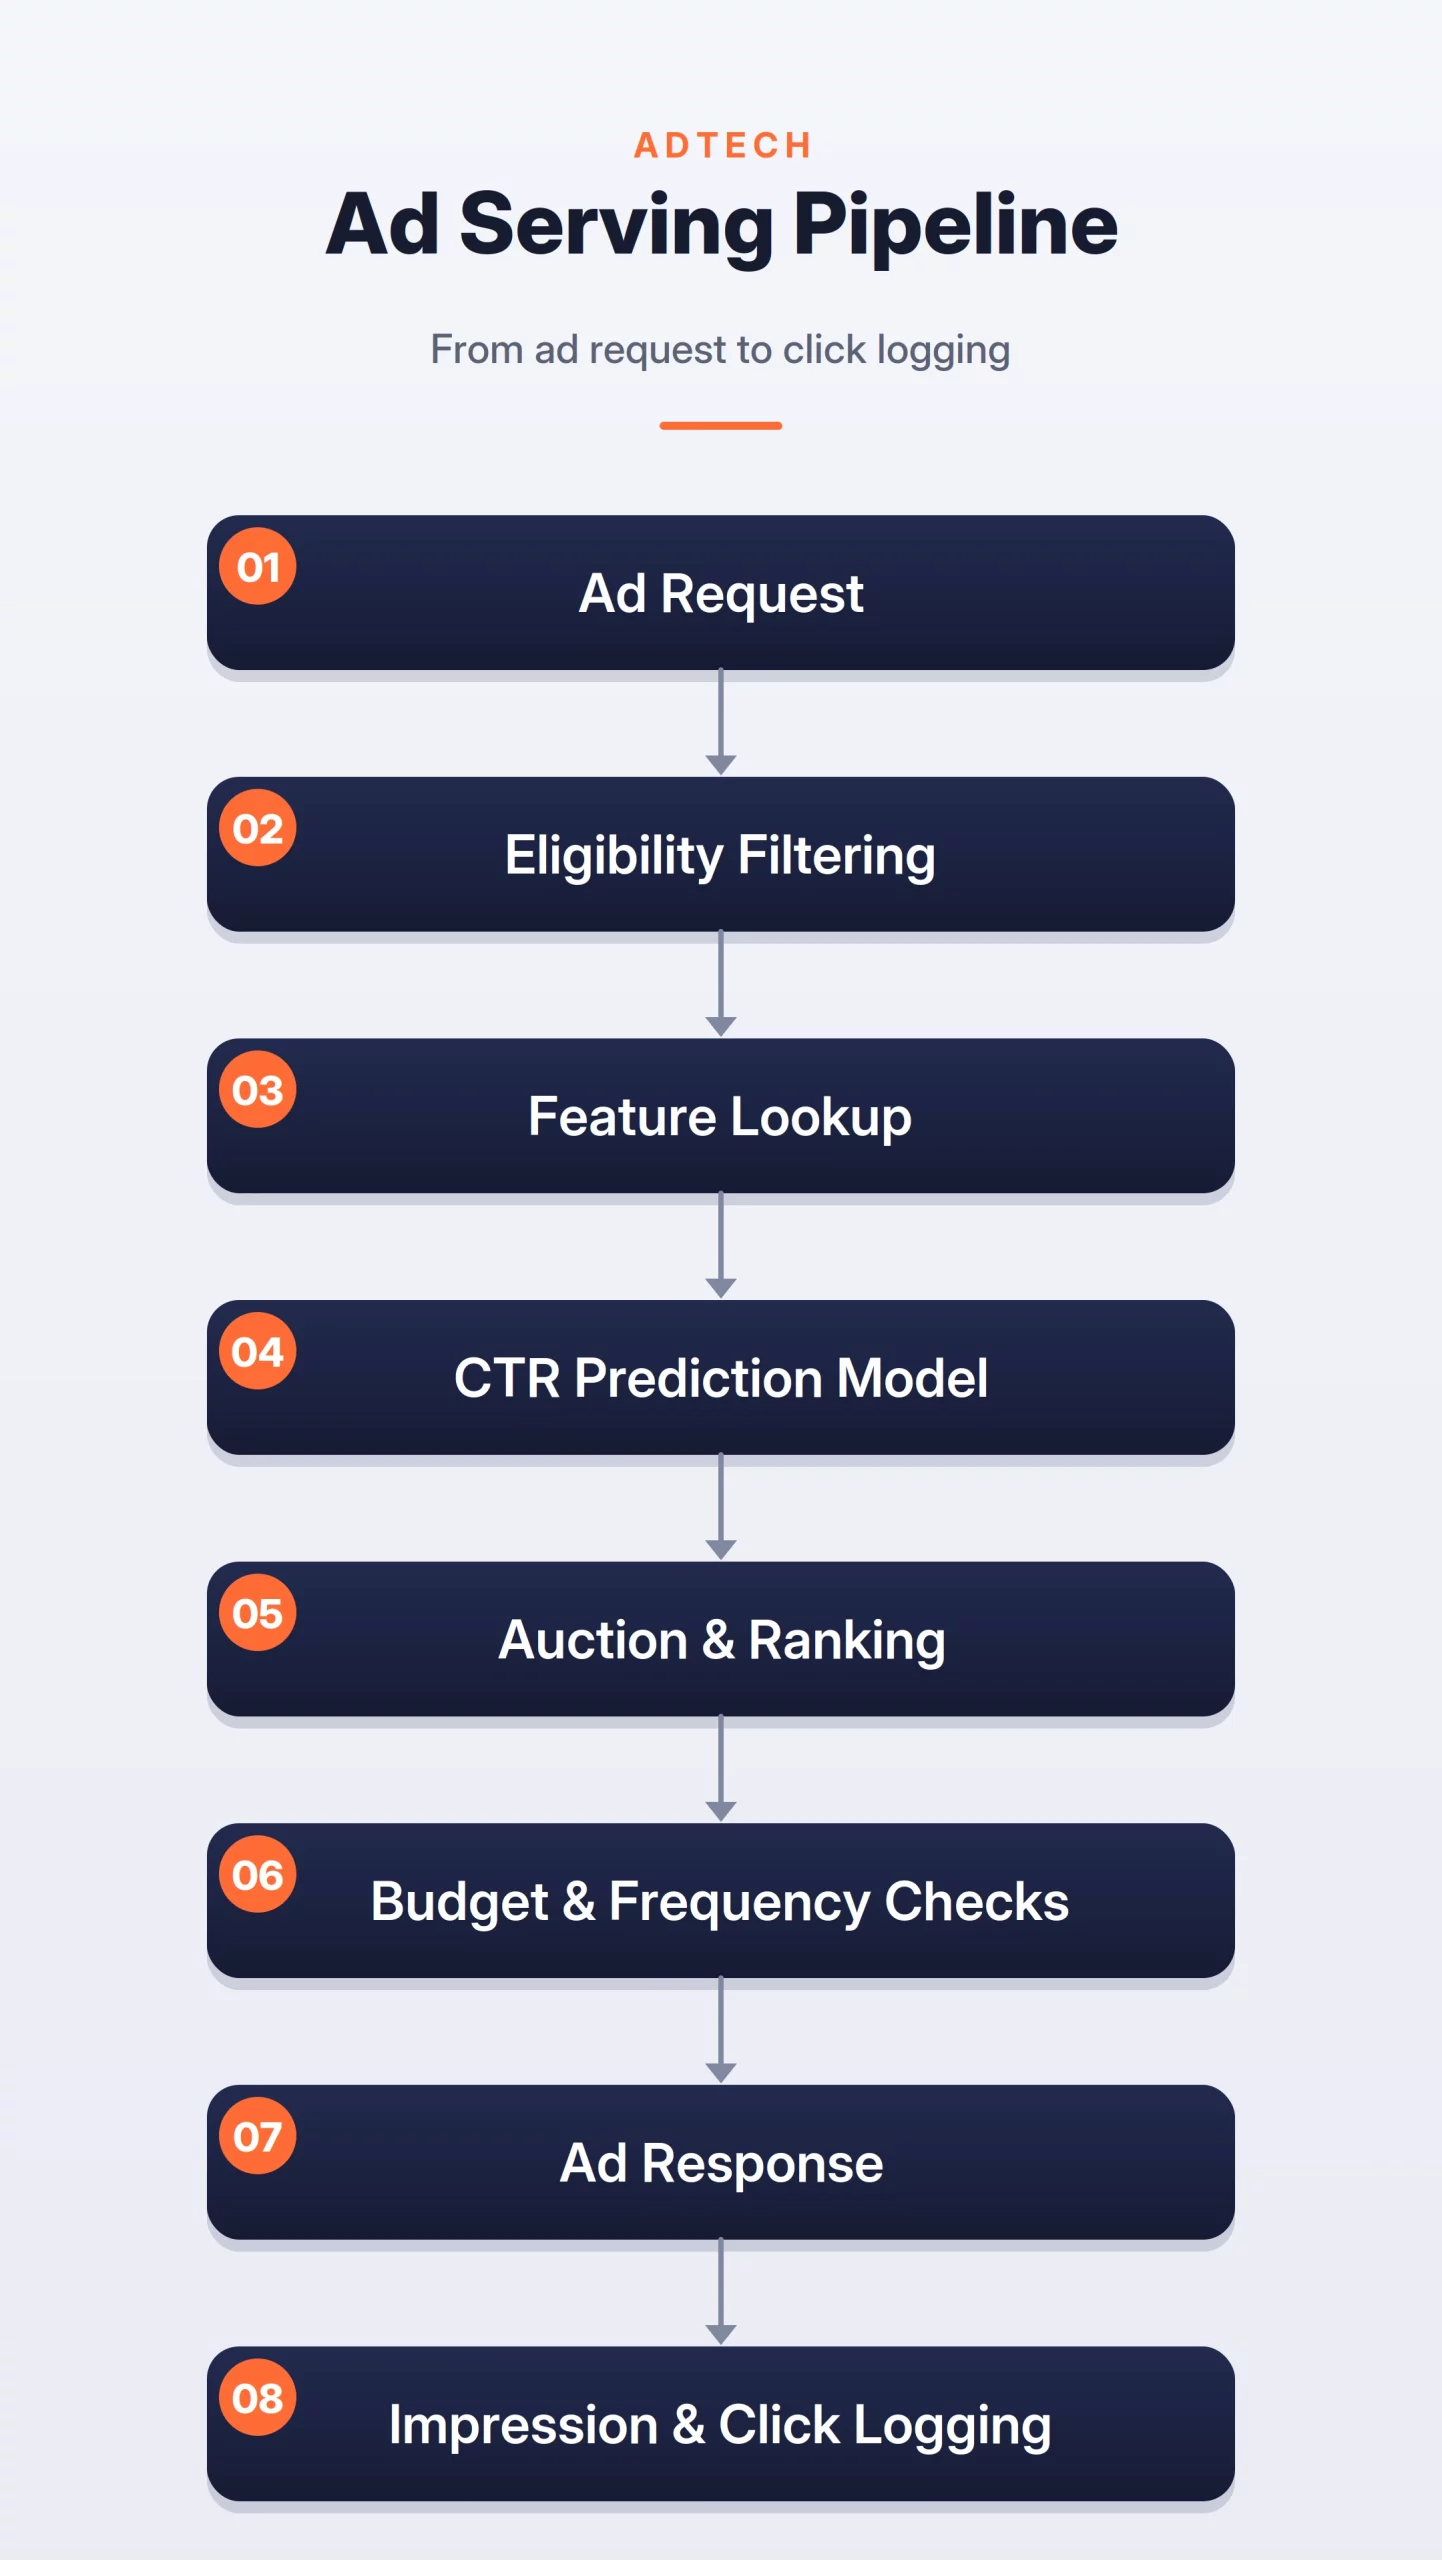
How the System Works
The system starts when an ad request is created. This can happen when a user opens a page, searches for something, or scrolls through a feed.
- The system filters ads that are not eligible. It checks campaign status, targeting rules, location, language, device type, budget, and policy constraints.
- The CTR model scores the remaining ads. It predicts the probability that the user will click each ad.
- The auction layer combines predicted CTR with advertiser bids. The final ad is selected based on expected value, quality, and business rules.
Ads CTR Prediction Flow
Important Signals
The model should use signals from the user, ad, advertiser, and context.
Useful signals include:
- User interests and past ad interactions
- Page or search context
- Ad category and creative type
- Advertiser quality score
- Device type and location
These signals help the model understand whether the ad is relevant in the current context. For example, a travel ad may perform better when the user is reading about vacation planning than when they are reading about finance.
Model Choice
A simple baseline can use logistic regression. It is fast, easy to train, and works well with sparse categorical features.
A stronger version can use gradient boosted trees or deep learning models with embeddings. These models can learn better interactions between users, ads, and context.
For very large ad systems, deep models are useful because there can be millions of users, ads, keywords, and categories.
Evaluation Metrics
Offline metrics include AUC, log loss, and calibration error. Calibration is very important here. If the model predicts a CTR of 5 percent, the real click rate should be close to 5 percent.
Online metrics include CTR, conversion rate, revenue per impression, advertiser ROI, budget pacing accuracy, and user complaint rate.
A good system should also track long-term user experience. If users start ignoring or hiding ads, the system may be optimizing the wrong thing.
Trade-offs
The main trade-off is revenue versus user experience. Showing high-paying ads may increase revenue, but those ads may not always be relevant.
There is also a trade-off between accuracy and latency. A larger model may predict CTR better, but the ad system must respond very quickly.
Another trade-off is exploration versus exploitation. The system needs to test new ads, but it should not show poor ads too often.
Interview Tip
In an interview, do not describe ads for CTR prediction as only a classification model. A real ads system also includes eligibility checks, auctions, budgets, frequency caps, policy filters, and logging.
This shows that you understand the full production system, not just the ML model.
3. E-commerce Search Ranking System
An e-commerce search ranking system decides which products appear for a user query across shopping apps, marketplaces, food delivery, and travel platforms.
The goal is to return useful results, not just keyword matches. The system must understand intent, product type, price, availability, quality, and user preference. For example, a query like “running shoes under 3000” should return affordable running shoes, not formal shoes or expensive products that only match the word “shoes.”
Problem Statement
Design a search ranking system for an e-commerce platform. Given a user query, return a ranked list of products that are relevant, available, and likely to satisfy the user.
The system should support keyword search, semantic search, spelling correction, filters, personalization, and low-latency ranking.
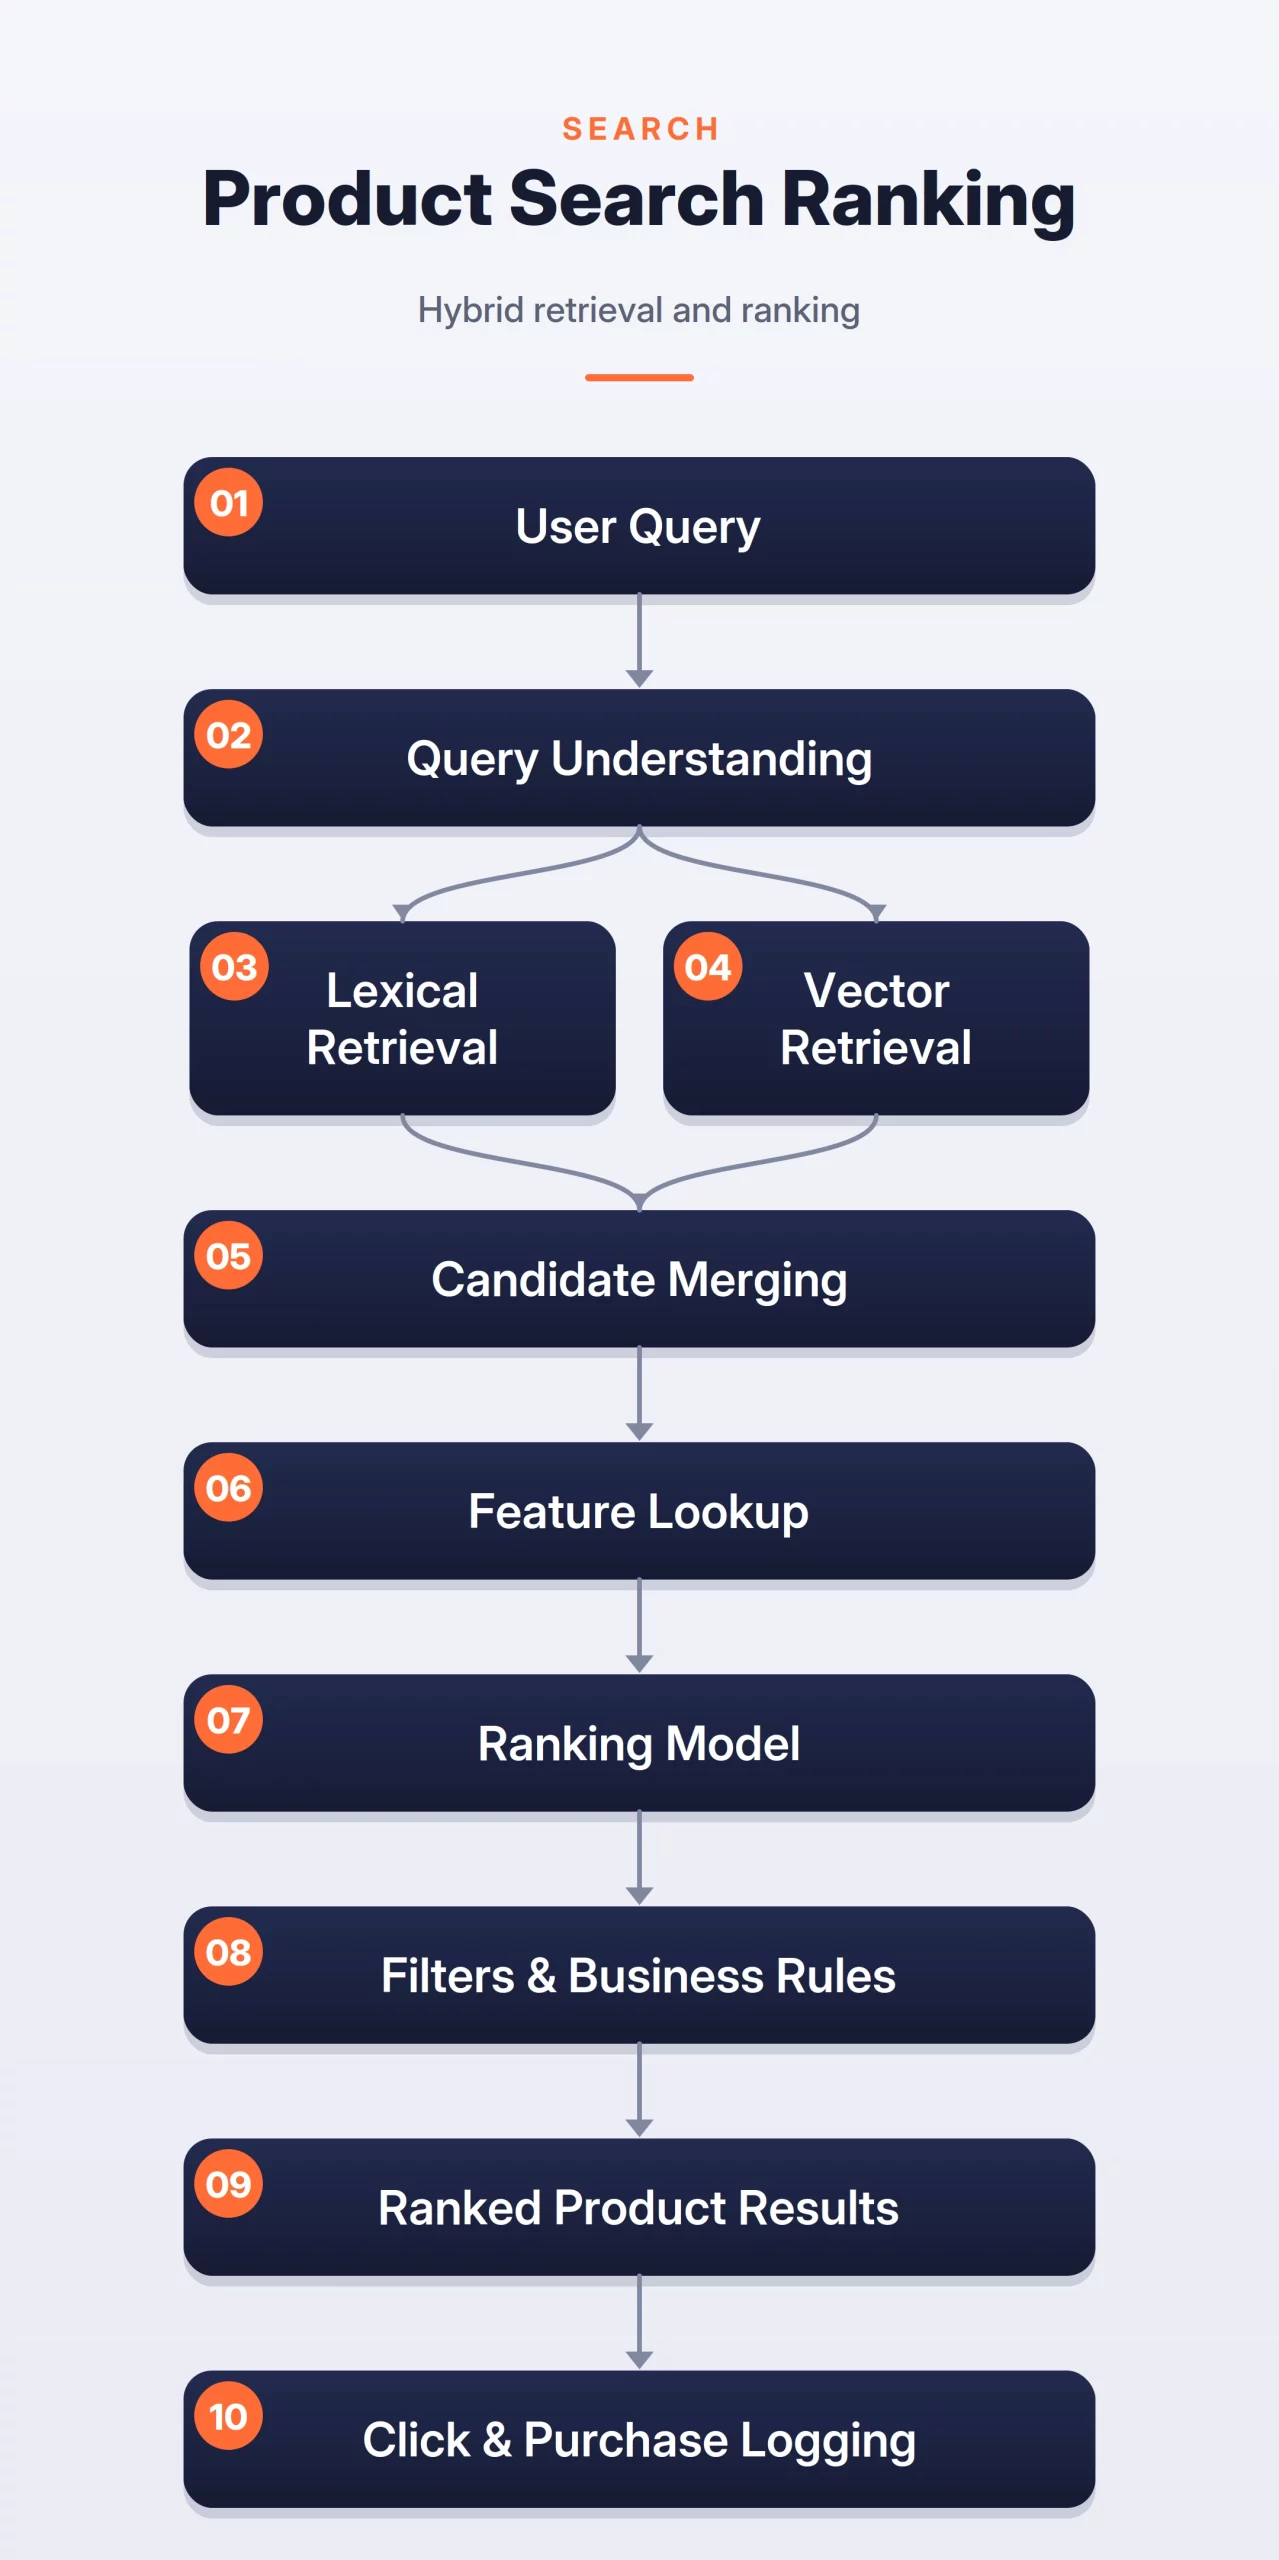
How the System Works
The system can be broken into three steps:
- Ranking and Rules: Merge candidates, rank them using relevance, popularity, price, ratings, availability, delivery speed, and user behavior, then apply business rules such as filters, sponsored boosts, and out-of-stock removal.
- Query Understanding: Clean and interpret the query using spelling correction, synonym expansion, category detection, and filter extraction.
- Candidate Retrieval: Retrieve products using lexical search for exact matches and semantic search for meaning-based matches.
E-commerce Search Ranking Flow
Important Signals
The ranking model should use signals from the query, product, user, and context.
Useful signals include:
- Query-product text match
- Semantic similarity
- Product category
- Price and discount
- Product rating and reviews
These signals help the system avoid shallow keyword matching. A product may match the query text, but if it is out of stock or poorly rated, it should not rank high.
Model Choice
A good baseline is BM25 with simple business rules. This is easy to build and gives strong results for exact keyword matching.
A better system can add vector retrieval for semantic matching. This helps with queries where the words do not exactly match product titles.
For final ranking, use a learning-to-rank model. LambdaMART, XGBoost ranker, or a neural re-ranker can be used depending on latency and scale.
Start simple. Then improve the system by adding semantic retrieval, personalization, and better ranking features.
Evaluation Metrics
Offline metrics include NDCG, MRR, precision@K, and recall@K. These metrics check whether relevant products appear near the top.
Online metrics include CTR, add-to-cart rate, purchase conversion rate, zero-result rate, and query reformulation rate.
Zero-result rate is especially important. If many users search and find nothing, the retrieval layer is weak.
Trade-offs
The main trade-off is relevance versus business value. The most relevant product may not always be the best result if it is out of stock, expensive, or poorly rated.
There is also a trade-off between lexical and semantic search. Lexical search is fast and precise. Semantic search improves recall but can return unexpected results.
Neural re-ranking can improve quality, but it adds latency. So it is usually applied only to the top candidates, not the full product catalog.
Interview Tip
In an interview, mention hybrid retrieval. A strong search system should not depend only on keyword search or only on vector search.
Also mention query understanding. Search quality often improves a lot when the system correctly handles spelling mistakes, synonyms, filters, and user intent.
4. Fraud Detection System
A real-time fraud detection system checks whether a transaction is risky across payments, banking, e-commerce, insurance, and digital wallets.
The goal is to stop fraud without blocking genuine users. If the system is too strict, good users get declined. If it is too lenient, the company loses money. So the system must make fast, careful risk decisions.
Problem Statement
Design a fraud detection system that scores payment transactions in real time. For each transaction, the system should decide whether to approve it, decline it, ask for extra verification, or send it for manual review.
The system should use historical behavior, real-time signals, rules, and ML predictions.
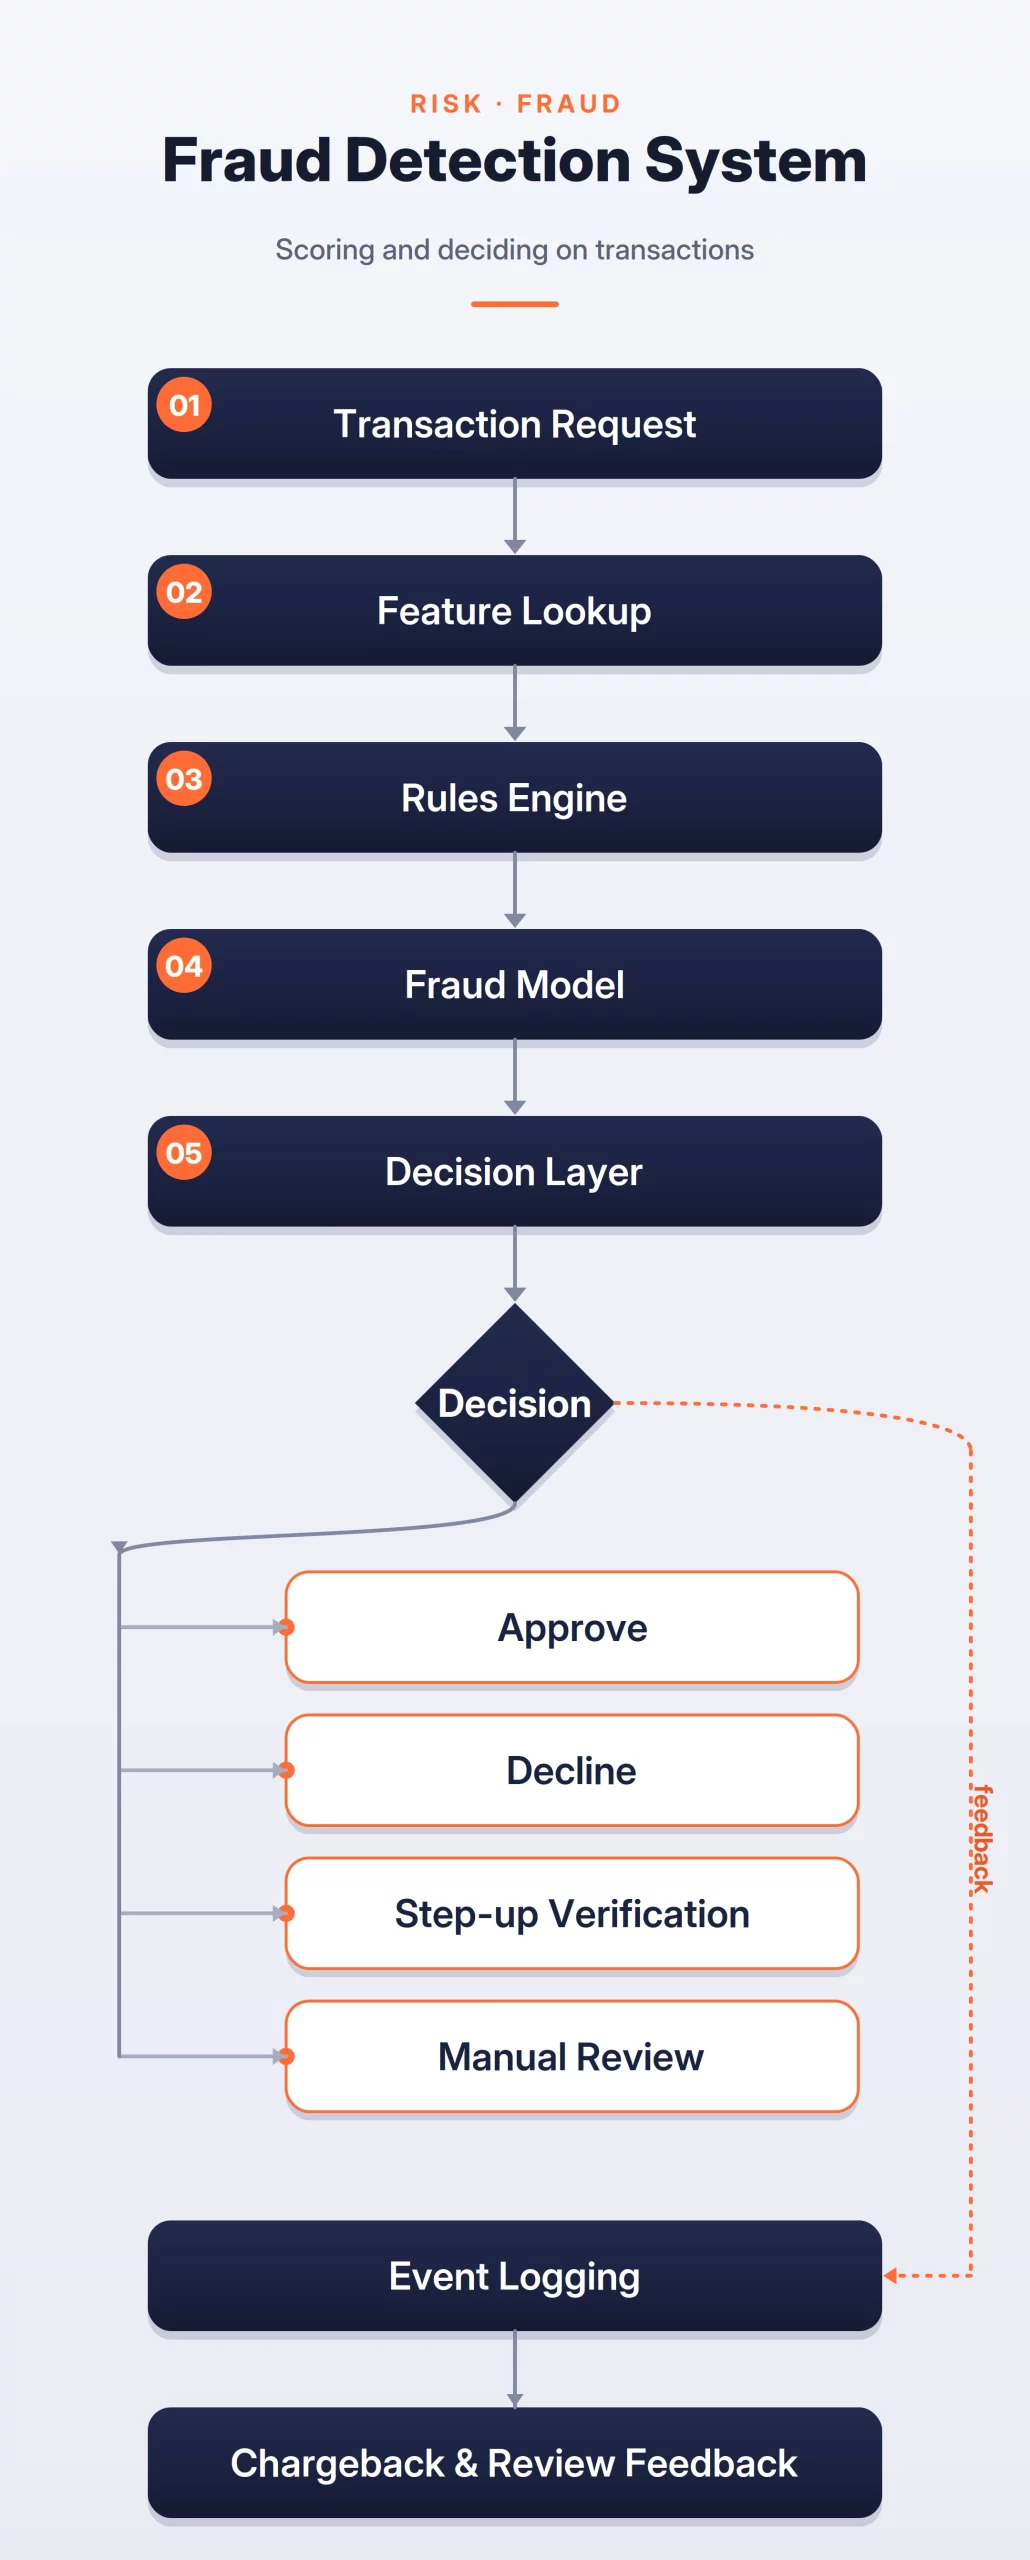
How the System Works
The system can be broken into three steps:
- Feature Extraction: Fetch transaction signals such as user history, card usage, merchant type, device information, IP location, and recent activity.
- Rules and ML Scoring: Apply rules for known risky patterns, then use an ML model to predict a fraud risk score.
- Final Decision: Combine the model score, rules, business limits, and risk policies to approve, decline, request verification, or send the transaction for manual review.
Fraud Detection Flow
Important Signals
The model should use signals that capture user behavior, transaction risk, and device patterns.
Useful signals include:
- Transaction amount and currency
- Merchant category
- Account age
- Device fingerprint
- IP location
These signals are useful because fraud often appears as unusual behavior. A sudden high-value transaction from a new device or country can be risky.
Model Choice
A good baseline is a gradient boosted tree model. Fraud data is usually tabular, imbalanced, and full of useful hand-crafted features.
Rules should not be removed. They are useful for hard constraints and known fraud patterns. The model handles patterns that are harder to express as rules.
For advanced systems, graph-based features can be added. These can detect groups of accounts connected by shared cards, devices, addresses, or IPs.
Evaluation Metrics
Offline metrics include precision, recall, PR-AUC, false positive rate, and cost-weighted loss.
PR-AUC is useful because fraud data is highly imbalanced. There are usually far fewer fraud transactions than genuine transactions.
Online metrics include fraud loss, approval rate, chargeback rate, manual review rate, and customer friction.
The system should also measure performance by segment. For example, new users, high-value transactions, and cross-border payments may behave differently.
Trade-offs
The biggest trade-off is fraud loss versus user friction. A strict model catches more fraud, but it may decline genuine users. A lenient model improves approval rate, but it may increase fraud loss.
There is also a latency trade-off. The system must score transactions quickly because the user is waiting. Heavy models or slow feature lookups can hurt the payment experience.
Another challenge is delayed labels. A transaction may look safe today, but a chargeback may arrive days or weeks later. This makes training and evaluation harder.
Interview Tip
In an interview, mention delayed labels and manual review. These are important in real fraud systems.
Also mention that the decision layer should combine rules and ML. Fraud detection is not only a model prediction problem. It is a risk decision system.
5. ETA Prediction System
An ETA prediction system estimates when a driver, rider, order, or shipment will arrive. It is widely used in ride-sharing, food delivery, logistics, and mapping platforms.
The goal is to provide accurate and reliable arrival times despite changing traffic, route choices, GPS noise, and varying pickup or drop-off delays. A good ETA system should be accurate, stable, and fast.
Problem Statement
Design an ETA prediction system for a ride-sharing or delivery app. Given the origin, destination, route, driver location, and current context, the system should predict the expected arrival or delivery time.
The system should support real-time updates as the trip progresses.
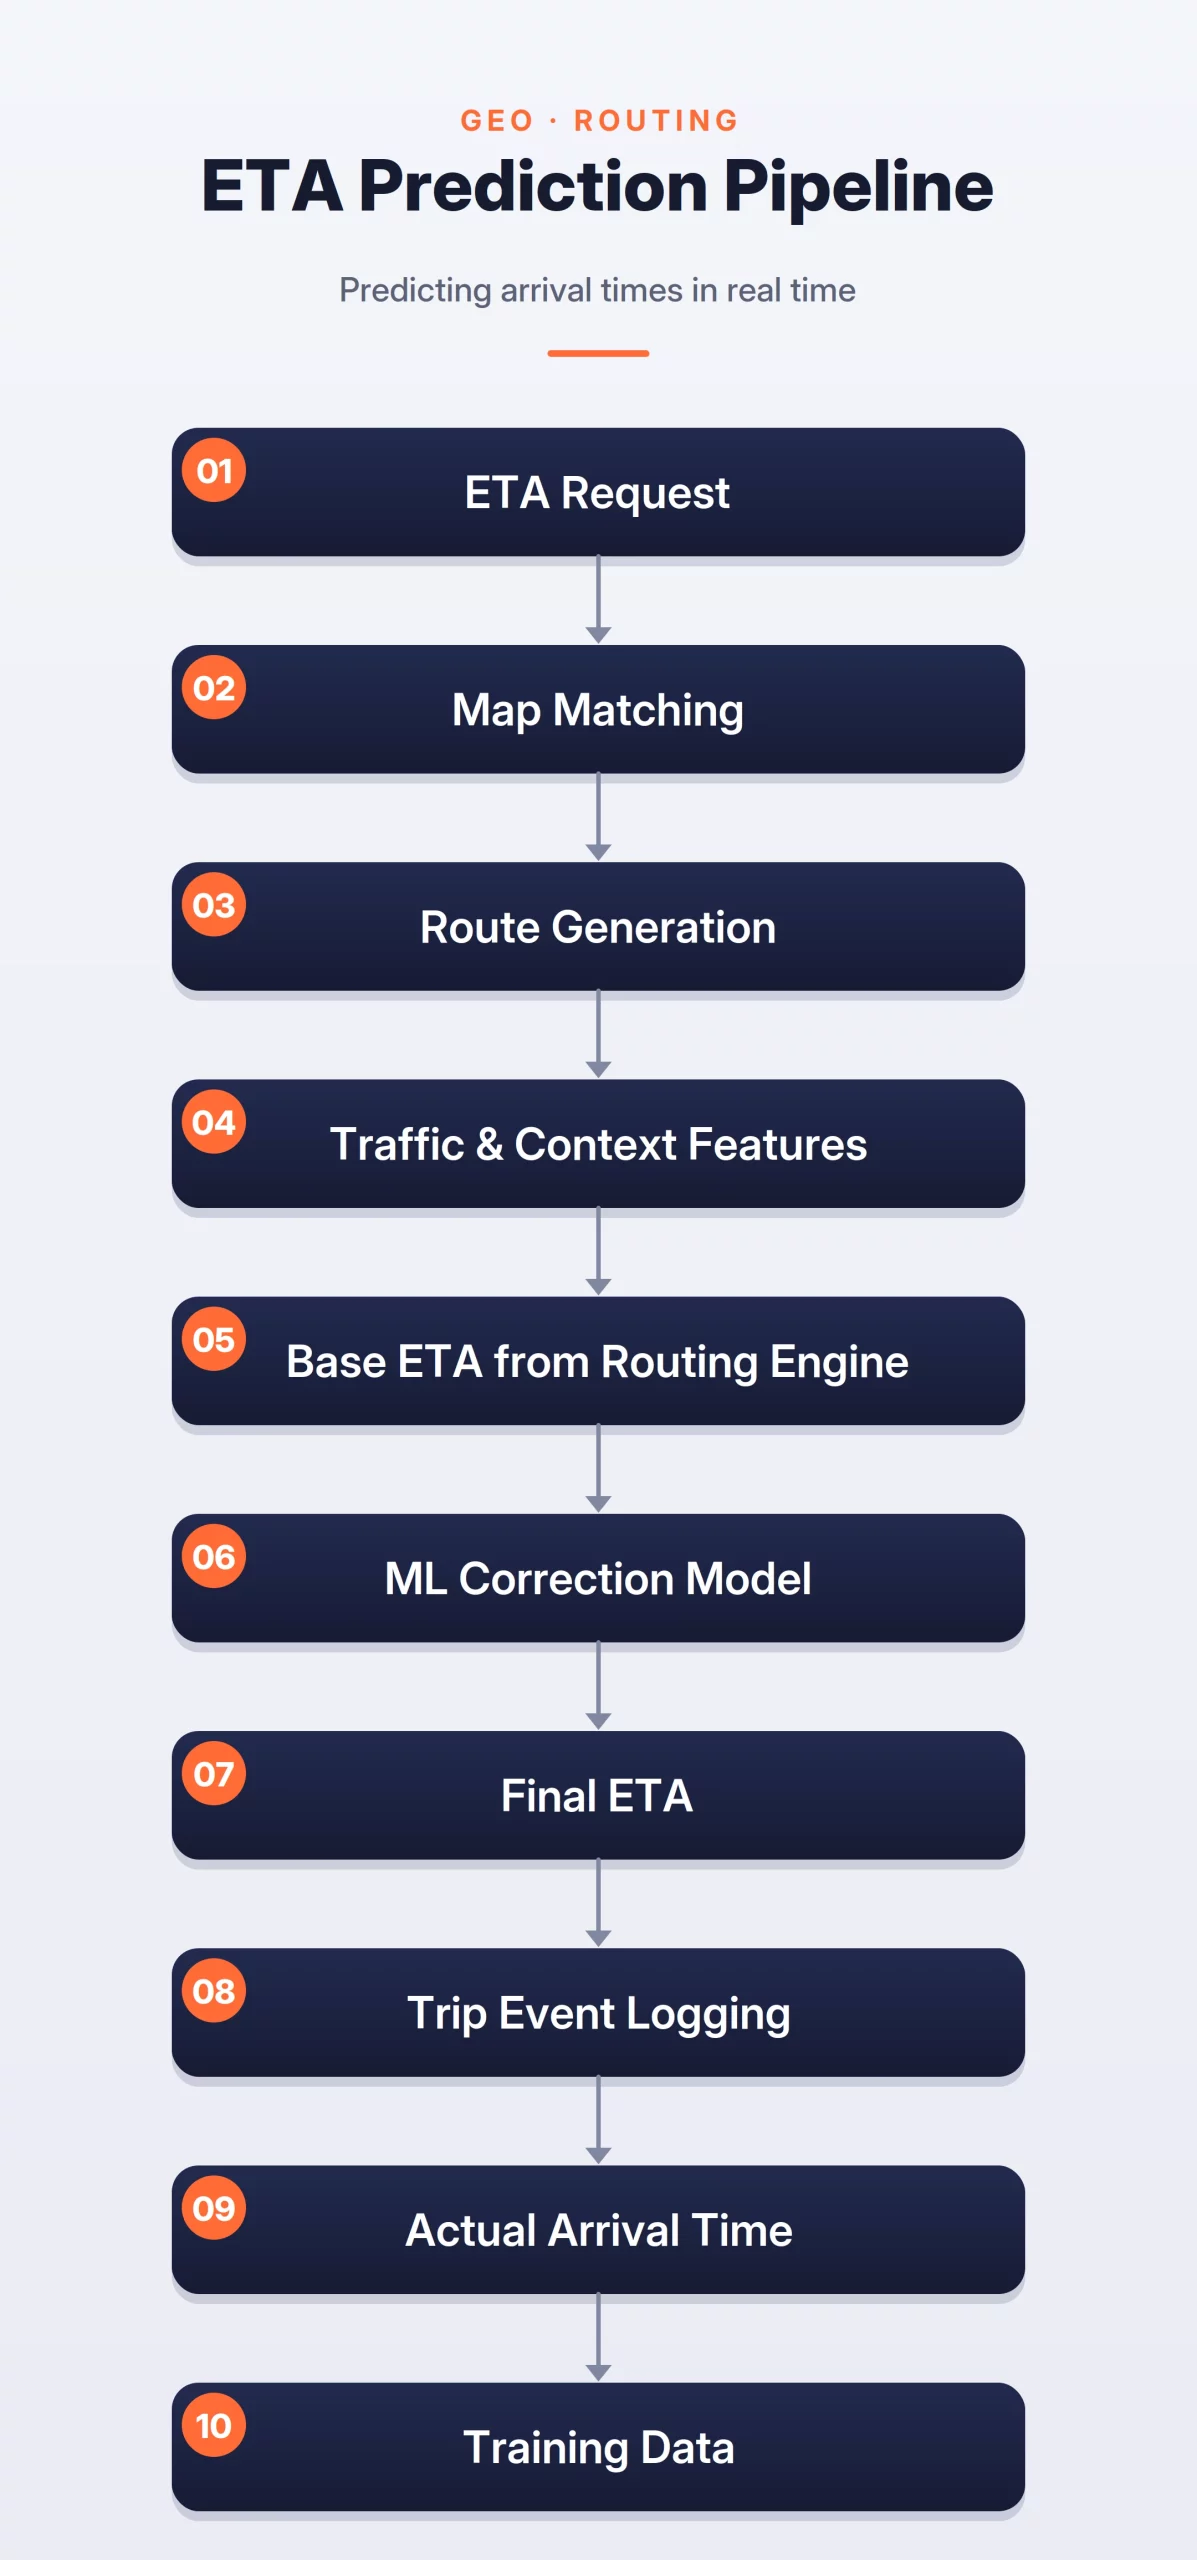
How the System Works
The system can be broken into three steps:
- Route Generation: Map the origin and destination to the road network and generate candidate routes using distance, road type, speed limits, and traffic data.
- Base ETA Estimation: Use a routing engine to calculate an initial travel time estimate for the selected route.
- ML-Based Adjustment: Refine the base ETA using factors such as live traffic, weather, driver behavior, and historical delays to produce a more accurate prediction.
ETA Prediction Flow
Important Signals
The model should use route, traffic, driver, and context signals.
Useful signals include:
- Origin and destination
- Route distance
- Road type
- Time of day
- Day of week
These signals help the system adjust for real-world conditions. For example, two routes with the same distance may have very different ETAs during peak traffic.
Model Choice
A good baseline is a gradient boosted tree model. It works well with structured features and is easy to debug.
The model can predict the final ETA directly, but a better design is to predict the residual error. This means the model learns how much the routing engine is usually wrong in a given context.
For advanced systems, sequence models or graph neural networks can be used. These can model traffic patterns across road networks. But they also increase complexity.
Evaluation Metrics
Offline metrics include MAE, RMSE, percentile error, and calibration. MAE is easy to understand because it measures average time error.
Online metrics include late delivery rate, cancellation rate, customer complaints, and ETA stability.
ETA stability matters because users do not like estimates that keep changing every few seconds. A slightly less accurate but stable ETA can sometimes feel better than a highly volatile one.
Trade-offs
The main trade-off is accuracy versus stability. Updating ETA too often can make the estimate more accurate, but it may also make the user experience worse.
There is also a trade-off between model complexity and reliability. A complex traffic model may improve accuracy, but it is harder to debug when predictions go wrong.
Latency is important too. ETA is often shown inside a live user flow, so the system must respond quickly.
Interview Tip
In an interview, mention that ML should improve the routing engine, not replace it completely.
Also mention residual prediction. It shows practical thinking because many production ETA systems combine rule-based routing with ML correction.
6. Spam and Phishing Detection System
A spam and phishing detection system decides whether an email is safe, unwanted, suspicious, or harmful.
The goal is not just text classification. It must also use sender reputation, domain history, links, attachments, and authentication checks to block harmful emails without hiding important ones.
Problem Statement
Design a system that classifies incoming emails as safe, spam, phishing, or suspicious.
The system should detect malicious links, fake senders, harmful attachments, and suspicious message patterns. It should also learn from user feedback, such as “mark as spam” or “not spam.”
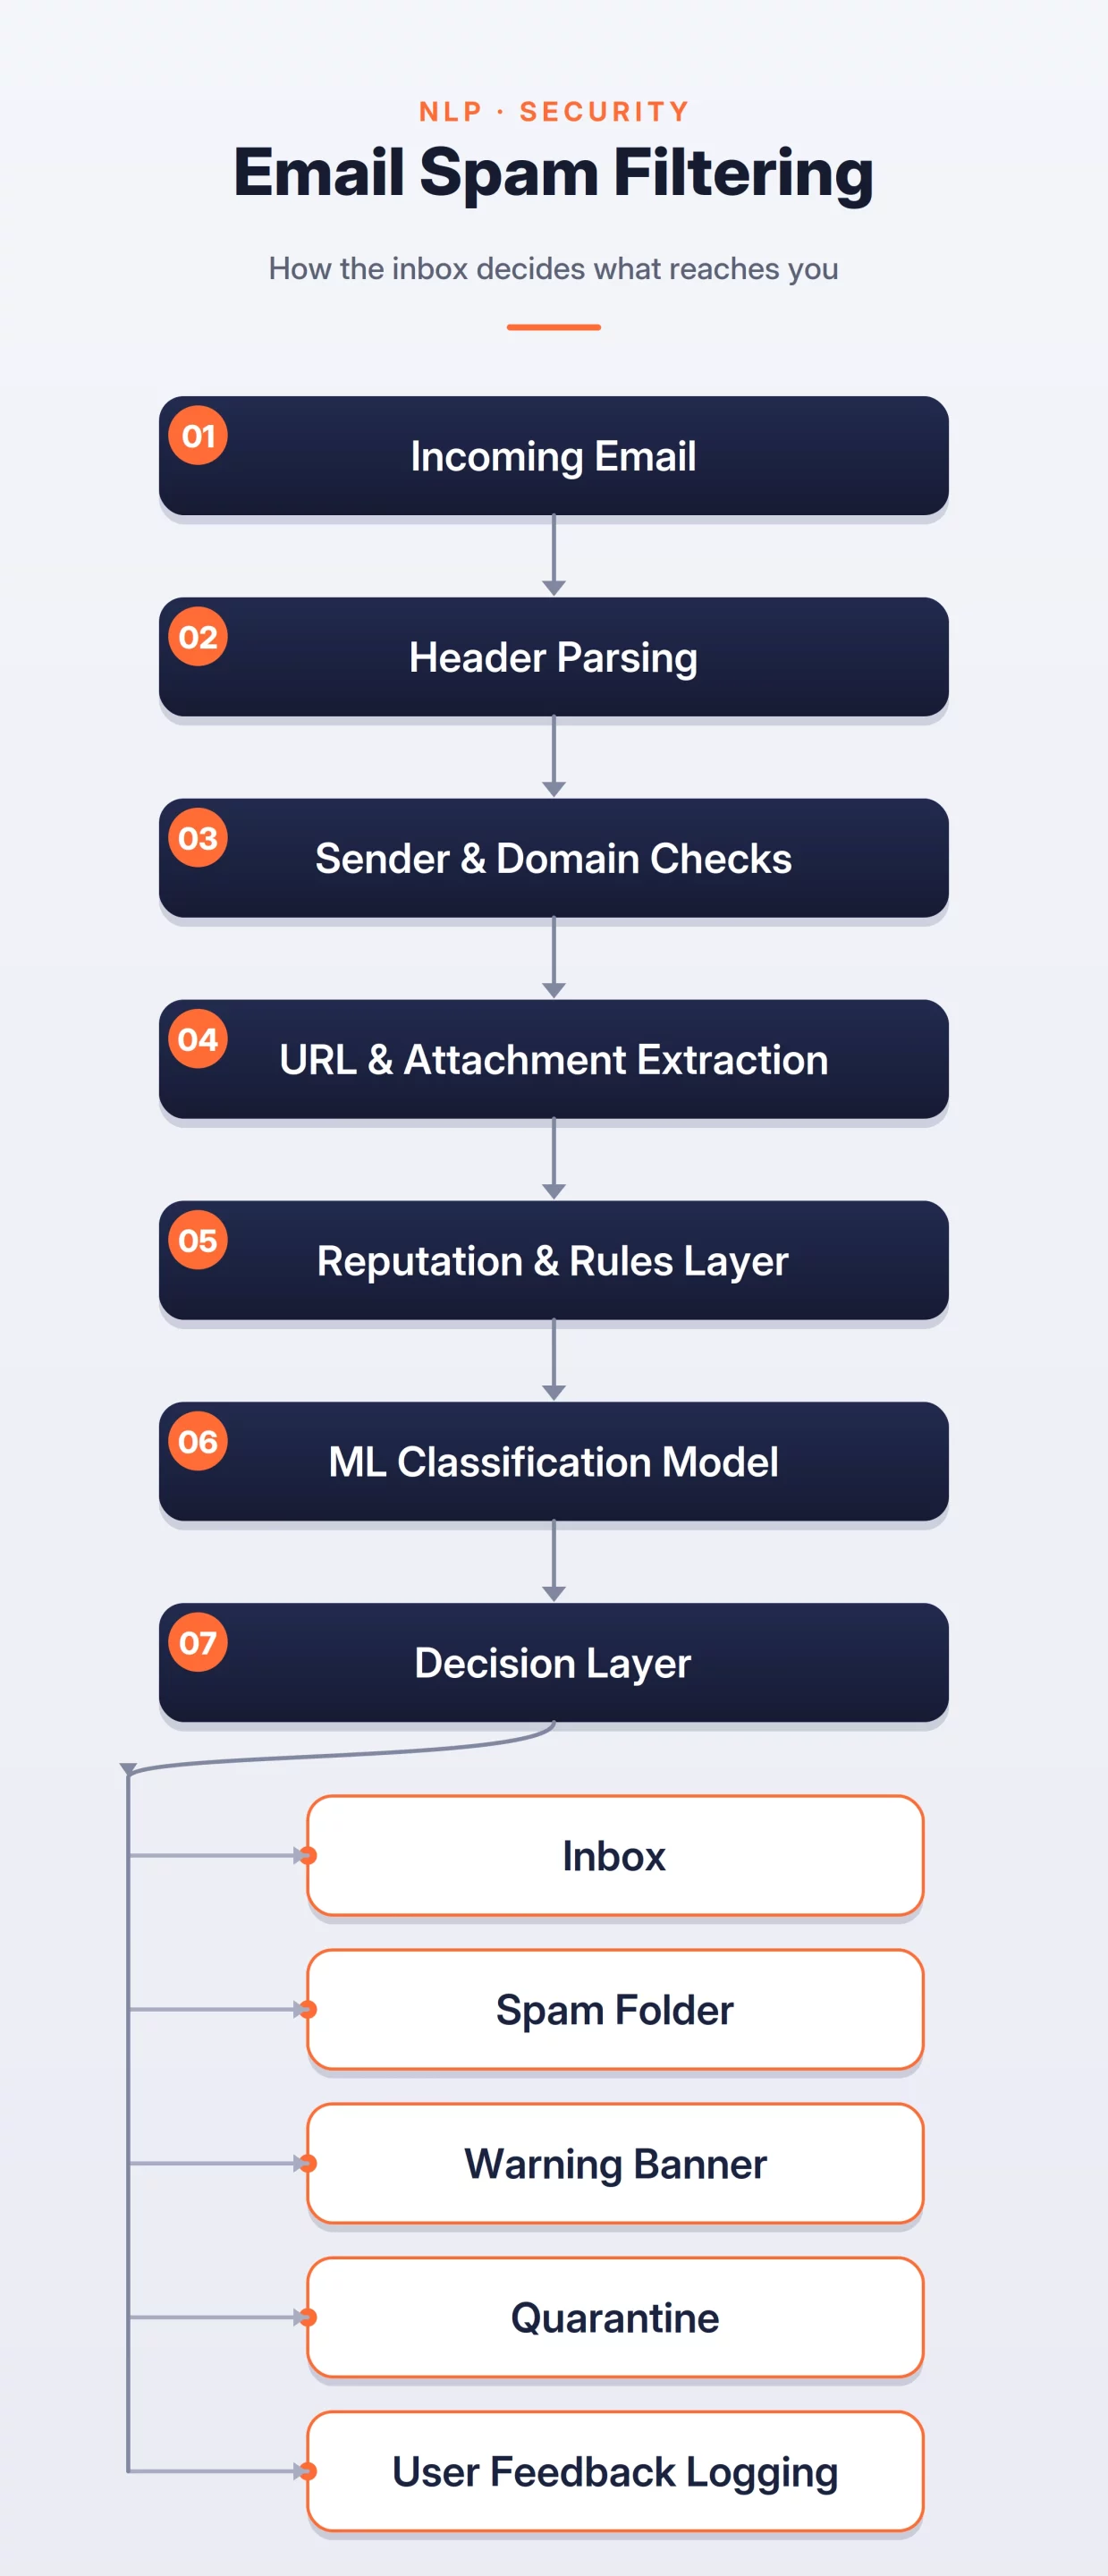
How the System Works
The system can be broken into three steps:
- Signal Extraction: Parse the email header, sender identity, domain reputation, authentication results, URLs, attachments, subject, and body text.
- Rules and ML Scoring: Apply rules to catch known threats, then use an ML model to score the email using text, sender, URL, and user behavior signals.
- Final Decision: Send the email to inbox, spam, warning, or quarantine based on the final risk score.
Spam and Phishing Detection Flow
Important Signals
The system should combine content signals and security signals. Text alone is not enough.
Useful signals include:
- Sender domain and sender reputation
- SPF, DKIM, and DMARC results
- Subject and body text
- URL reputation
- Attachment type
These signals help the system catch different types of attacks. A phishing email may look normal in text, but it may contain a suspicious link or come from a newly created domain.
Model Choice
A good baseline is a text classification model with sender and URL features. Logistic regression or gradient boosted trees can work well for the first version.
A more advanced system can use transformer-based models for subject and body understanding. These models can detect subtle phishing patterns better than simple keyword rules.
Still, the system should not depend only on the ML model. Rules, reputation checks, and authentication results are critical for security.
Evaluation Metrics
Offline metrics include precision, recall, F1 score, and false positive rate.
False positives are very important. If a safe email is moved to spam, the user may miss something important.
Online metrics include phishing catch rate, user complaint rate, spam folder correction rate, and important-email false positive rate.
The system should also track new attack patterns. Phishing campaigns change quickly, so old test data may not reflect current threats.
Trade-offs
The main trade-off is safety versus user trust. Aggressive filtering catches more harmful emails, but it can also block genuine messages.
Conservative filtering reduces false positives, but more spam or phishing may reach the inbox.
There is also a cost trade-off. Deep content scanning and attachment sandboxing improve safety, but they add latency and infrastructure cost.
Interview Tip
In an interview, do not present this as only an NLP problem. A real spam and phishing system combines text classification, sender reputation, URL intelligence, authentication checks, rules, and user feedback.
This shows that you understand how security-focused ML systems work in production.
7. Visual Defect Detection System
A visual defect detection system identifies faulty products on manufacturing lines, warehouses, and quality control pipelines.
The goal is to catch defects before products reach customers, reducing waste, returns, safety risks, and manual inspection effort. Since products often move continuously, the system must be accurate and fast enough for near real-time decisions.
Problem Statement
Design a computer vision system that detects product defects from images.
The system should decide whether a product should pass, fail, or go for human review. If needed, it should also locate the defect in the image.
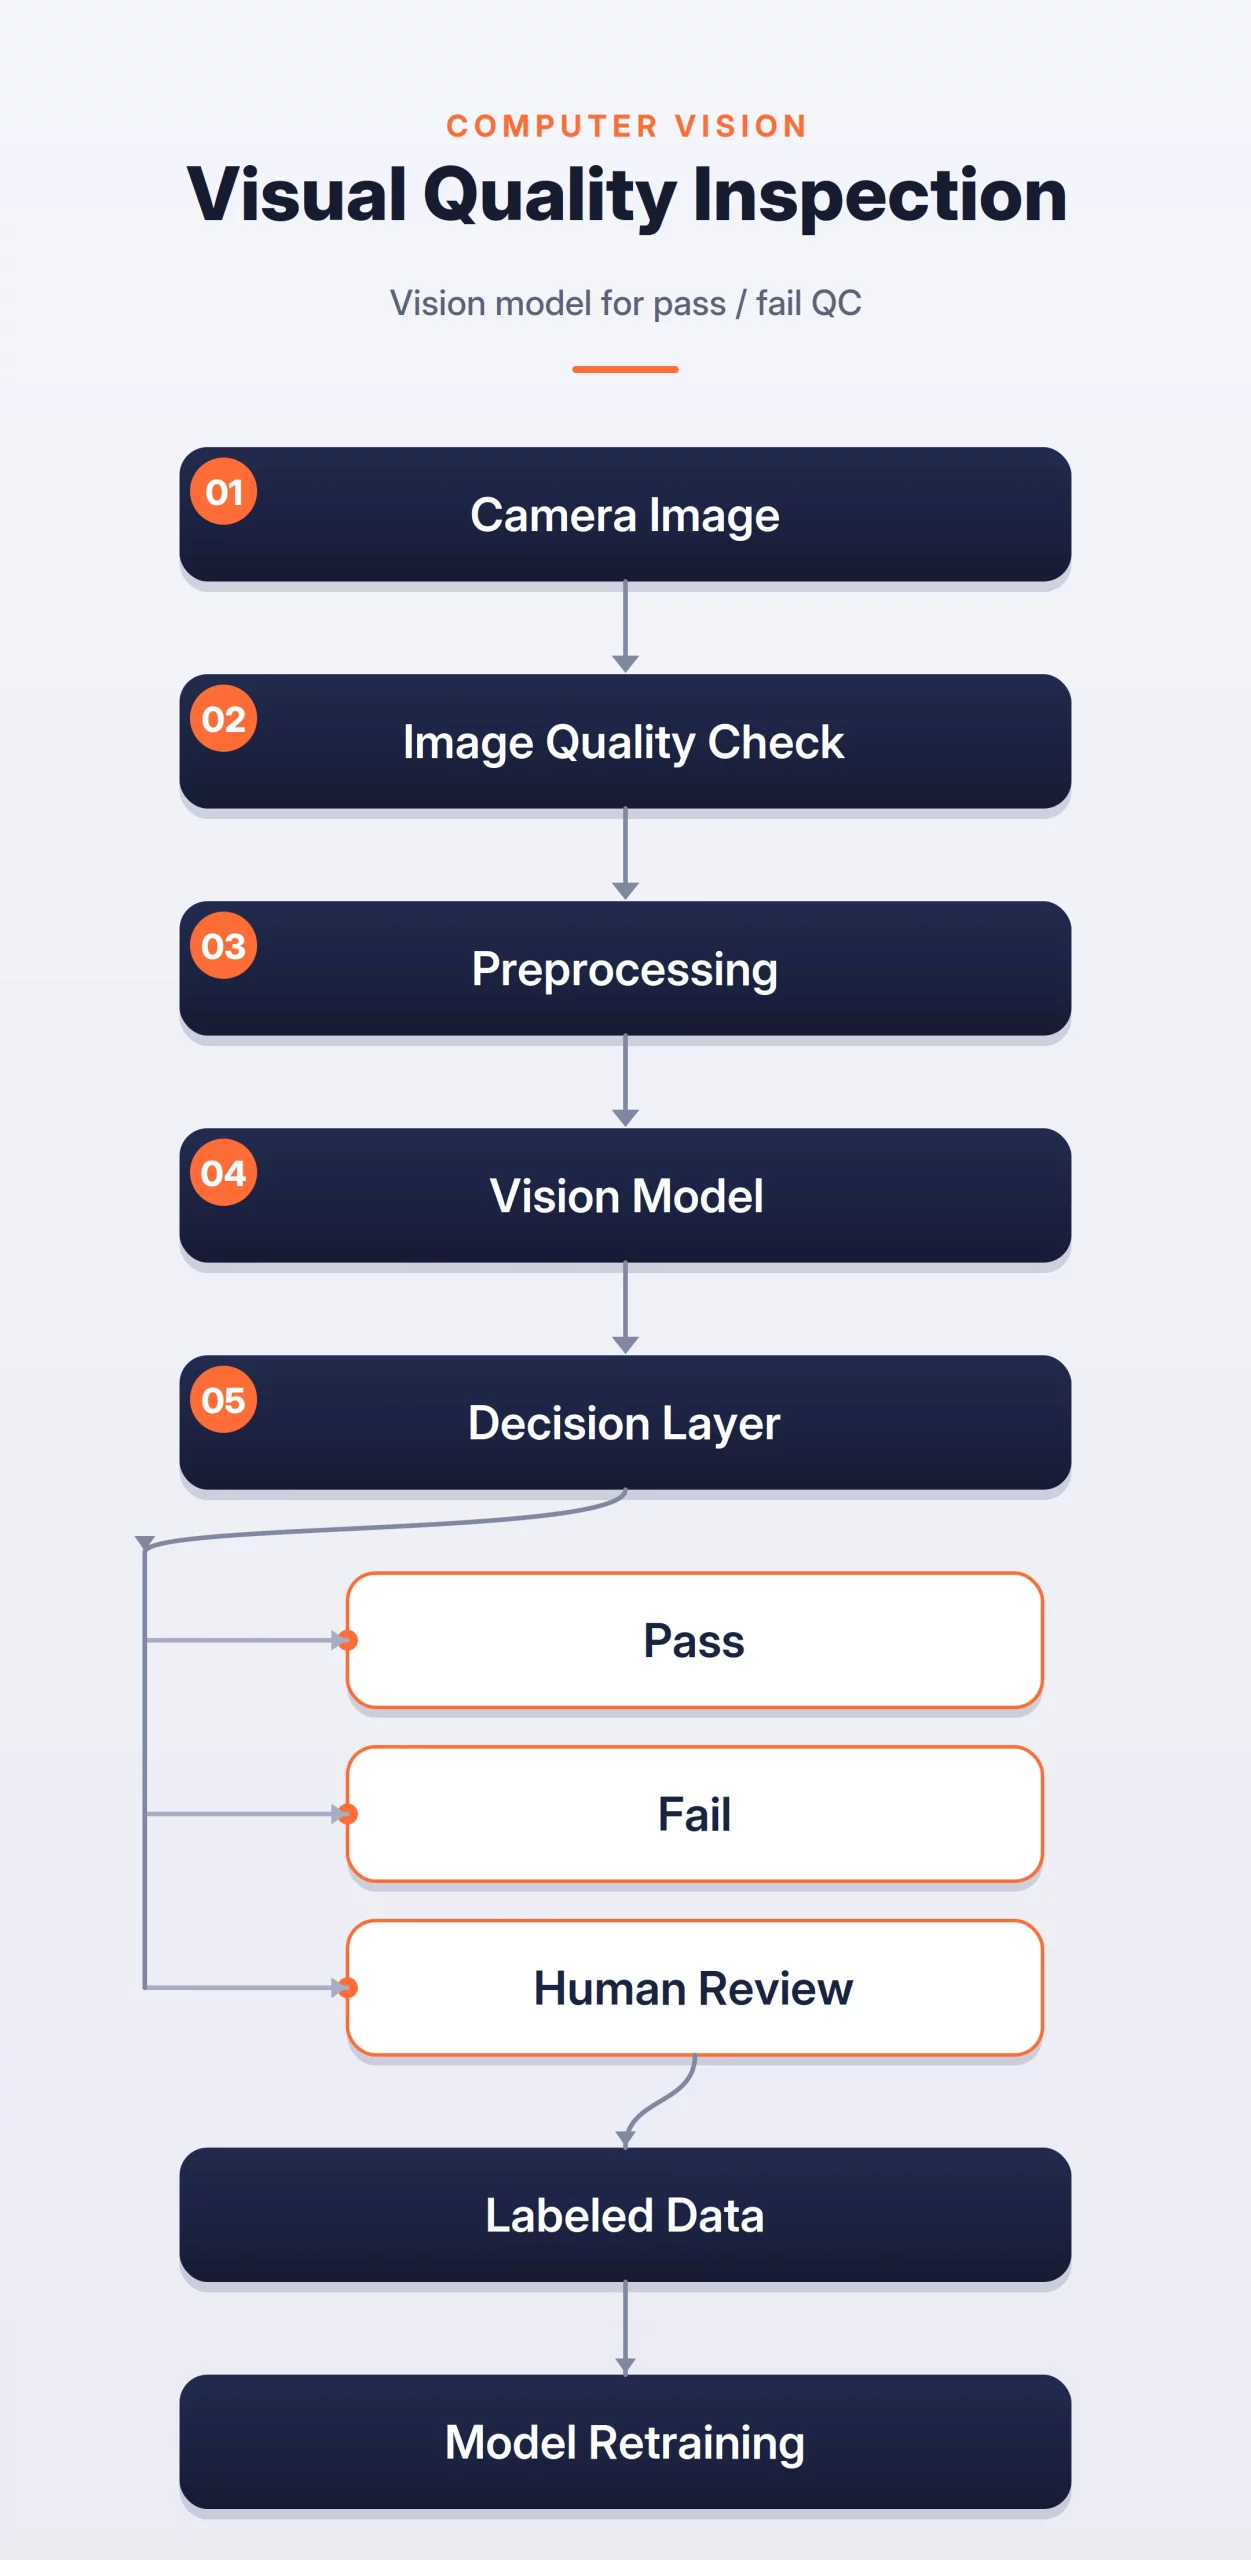
How the System Works
The system can be broken into three steps:
- Image Capture and Quality Check: Capture product images on the production line and check for issues like poor lighting, blur, camera movement, or wrong angles.
- Vision Model Inference: Preprocess the image and use a vision model to classify defects, detect defect boxes, or segment defect regions.
- Final Decision: Mark the product as pass or fail if confidence is high, or send uncertain cases to human reviewers for feedback and future training data.
Visual Defect Detection Flow
Important Signals
The image is the main input. But metadata can also help the system understand the production context.
Useful signals include:
- Product type
- Camera ID
- Production line
- Batch ID
- Timestamp
These signals are useful because defects may depend on a specific machine, batch, material, or production condition.
Model Choice
The model choice depends on the output needed.
If the system only needs pass or fail, image classification is enough. Also it needs to show where the defect is, object detection is better. If it needs exact defect boundaries, segmentation is the better choice.
A good baseline is transfer learning with a pretrained CNN or vision transformer. This is practical because defect datasets are often small.
For object detection, models like YOLO-style detectors or Faster R-CNN can be used. For segmentation, a U-Net-style model is a strong baseline.
Evaluation Metrics
Offline metrics include precision, recall, F1 score, IoU, and defect-level recall.
Recall is very important when missing a defect is costly. Precision is important when false rejects create waste.
Online metrics include false reject rate, false accept rate, review rate, inference latency, and production downtime.
The system should also track model performance by product type, camera, and production line. This helps detect camera drift or process issues.
Trade-offs
The main trade-off is recall versus waste. High recall catches more defects, but it may reject good products. High precision reduces waste, but it may miss some defects.
There is also a trade-off between edge inference and cloud inference. Edge inference is faster and works even with weak network connectivity. Cloud inference is easier to update and monitor, but it adds latency and depends on network reliability.
Another challenge is data imbalance. Defects are often rare. The system may see thousands of normal products for every defective one.
Interview Tip
In an interview, mention image quality monitoring. Many real vision systems fail because of lighting changes, camera shifts, blur, or dirty lenses.
Also mention human review. It helps handle uncertain cases and creates new labeled data for retraining.
8. Demand Forecasting System
A demand forecasting system predicts future product demand for retail, e-commerce, manufacturing, and supply chain operations.
The goal is to maintain the right inventory levels. Underestimating demand can lead to stockouts, while overestimating it can result in excess inventory and higher costs. A good forecasting system should be accurate, stable, and useful for planning.
Problem Statement
Design a demand forecasting system for products across stores, regions, or warehouses.
The system should predict future demand for each product and time period. It should also handle holidays, promotions, seasonality, new products, and stockouts.
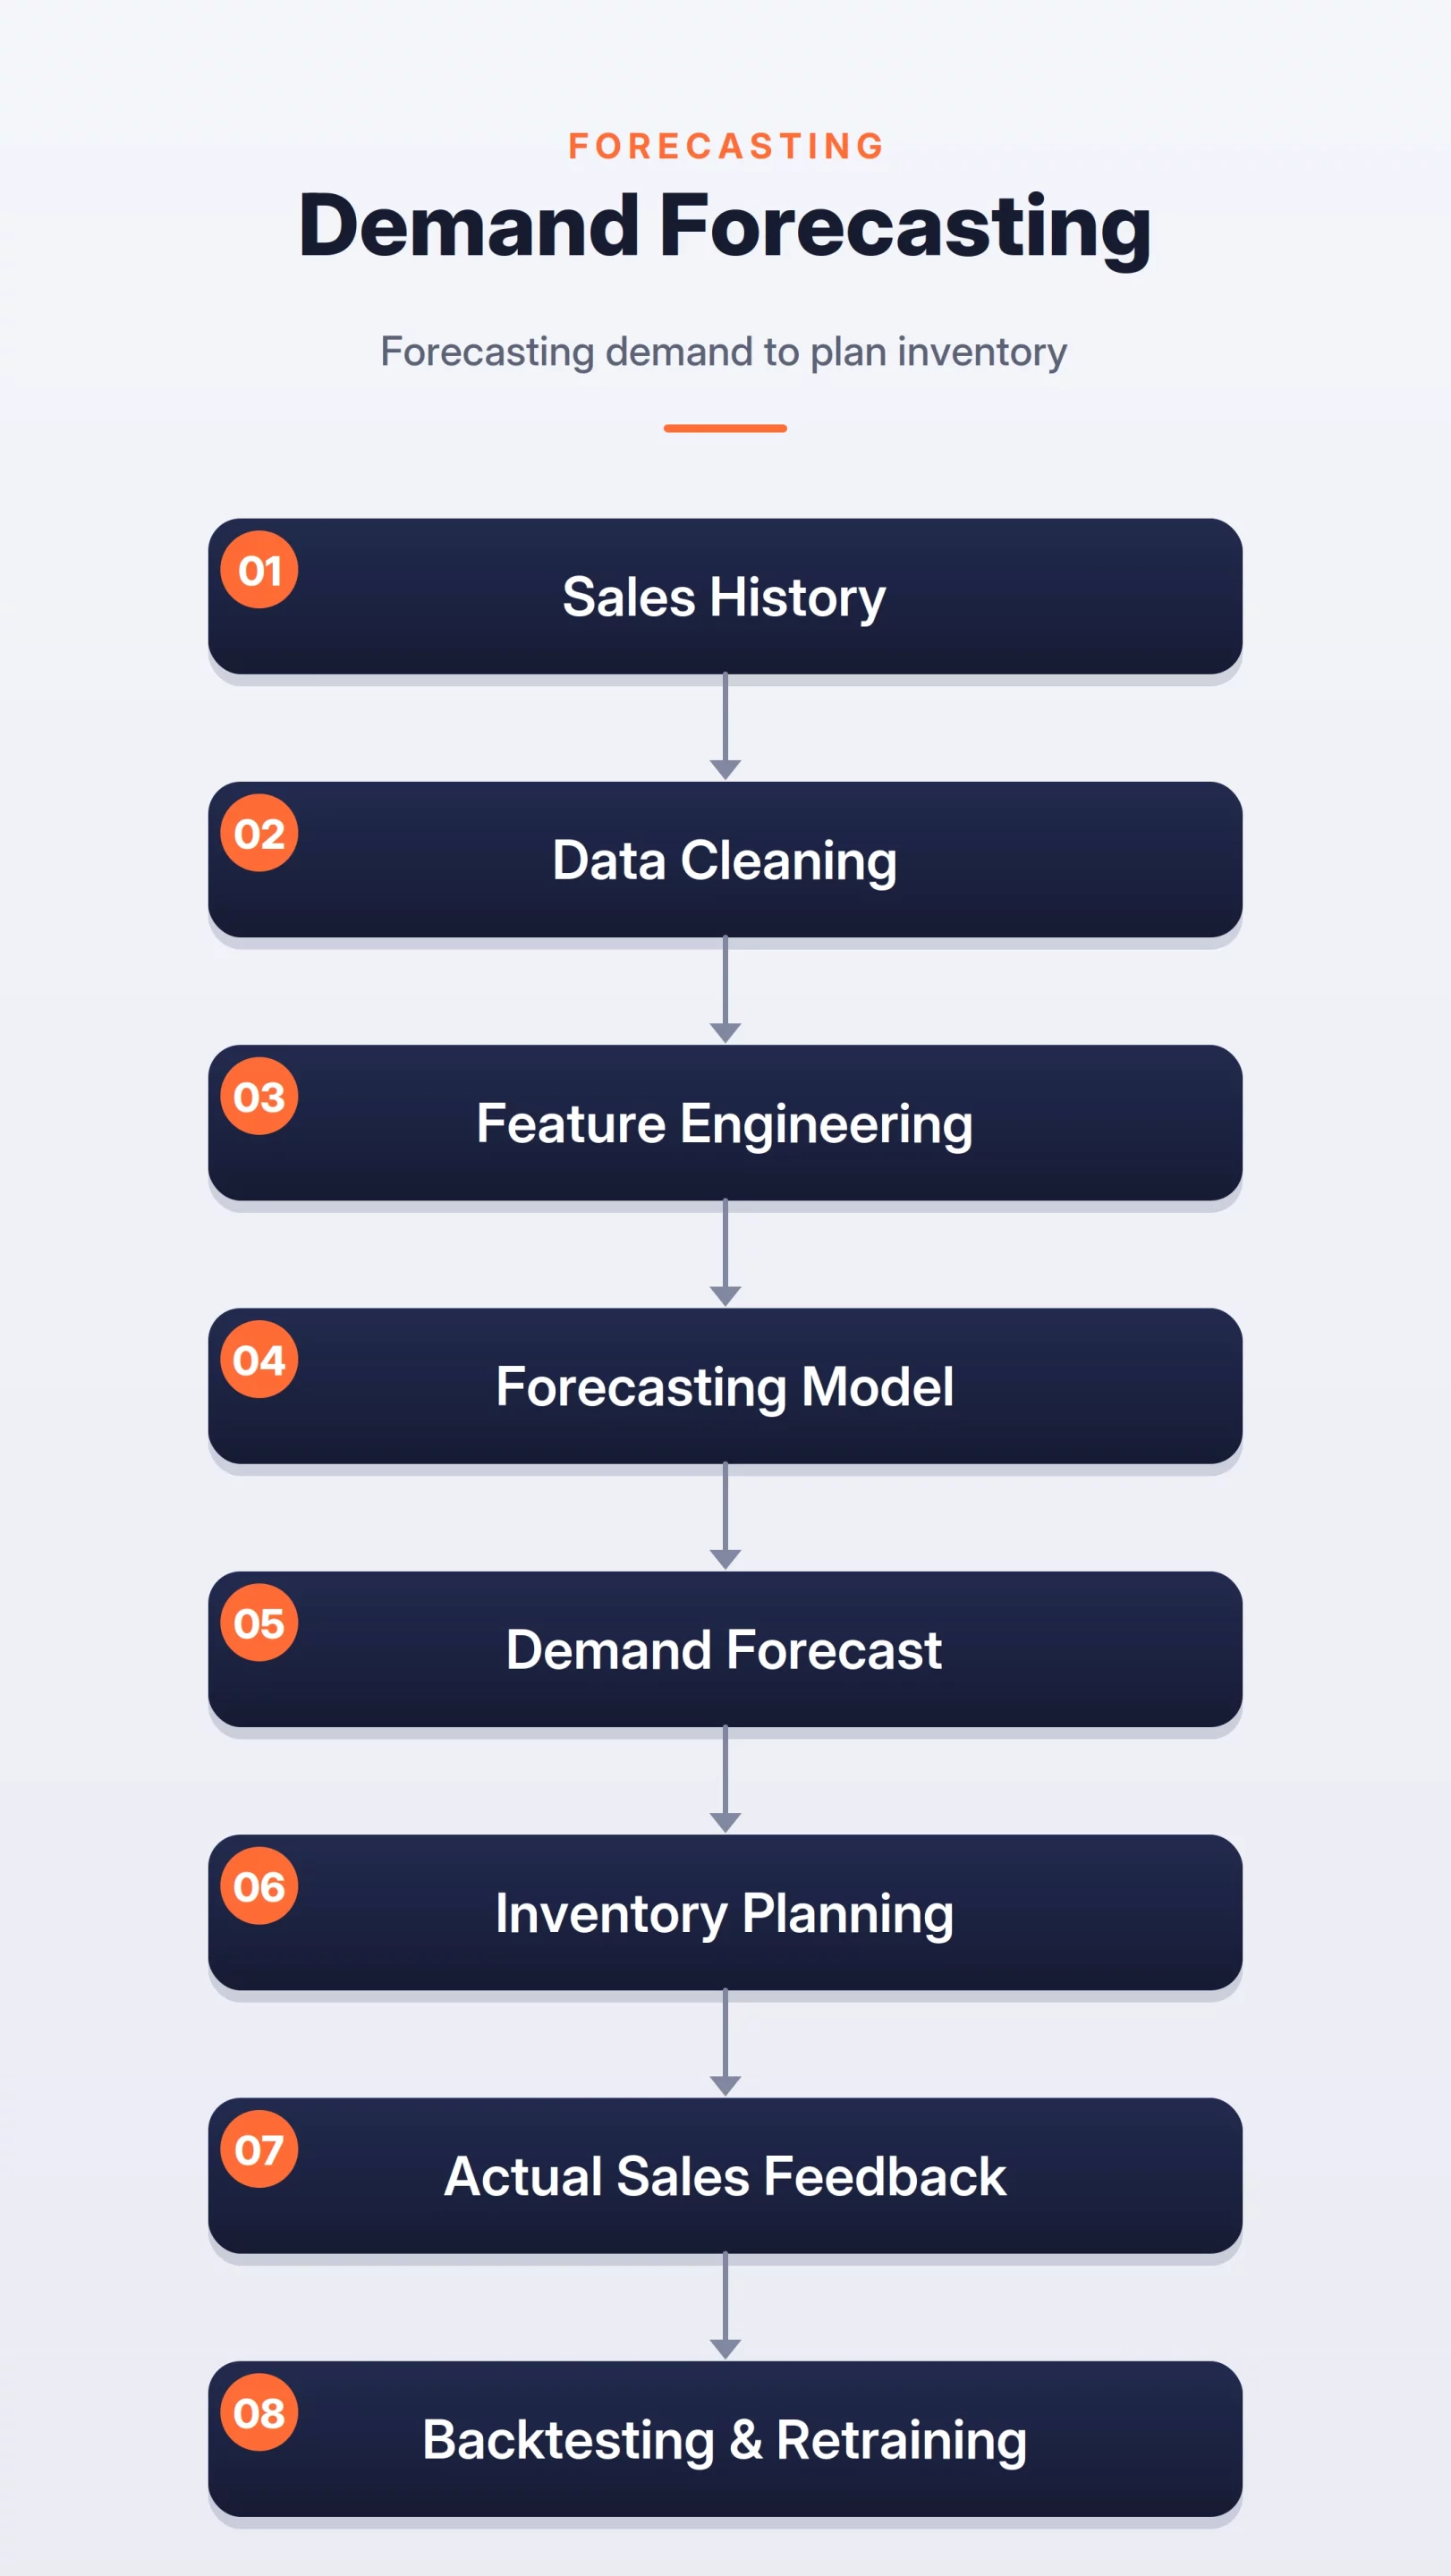
How the System Works
The system can be broken into three steps:
- Data Preparation: Collect historical sales, inventory, pricing, promotions, holidays, product metadata, and store data, then clean missing values, stockouts, returns, and unusual spikes.
- Feature Engineering and Forecasting: Create time-based features such as day of week, seasonality, holidays, promotions, and recent sales trends, then predict future demand.
- Planning and Feedback: Send forecasts to inventory or replenishment systems, compare predictions with actual sales, and use the feedback for backtesting and retraining.
Demand Forecasting Flow
Important Signals
The model should use sales, product, pricing, and calendar signals.
Useful signals include:
- Historical sales
- Product category
- Store or region
- Price and discount
- Promotion status
Stockout information is very important. If a product was out of stock, observed sales do not show true demand. The user may have wanted to buy the product, but could not.
Model Choice
A simple baseline can use moving averages or exponential smoothing. These are easy to explain and work well for stable products.
A stronger system can use gradient boosted trees with time-based features. This works well when the model needs to combine sales history with price, promotions, and product metadata.
For large-scale forecasting, global time-series models can be used. These models learn patterns across many products and stores instead of training one separate model for each item.
Probabilistic forecasting is also useful. Instead of giving one number, the system can predict a range. This helps planners prepare for uncertainty.
Evaluation Metrics
Offline metrics include MAE, RMSE, MAPE, WAPE, and pinball loss for probabilistic forecasts.
WAPE is often useful in business settings because it measures error relative to total demand.
Business metrics include stockout rate, inventory holding cost, waste, service level, and lost sales.
The model should also be evaluated across segments. Fast-moving products, slow-moving products, seasonal products, and new products may behave differently.
Trade-offs
The main trade-off is granularity versus noise. Forecasting at store-product-day level is useful, but it can be noisy. Forecasting at category-region-week level is more stable, but less detailed.
There is also a trade-off between accuracy and explainability. Simple models are easier for planners to trust. Complex models may be more accurate, but harder to explain.
Another challenge is new products. They do not have enough history. The system can use similar products, category patterns, or launch plans to create a cold-start forecast.
Interview Tip
In an interview, mention stockout bias. Sales are not always equal to demand. If inventory was unavailable, the data is censored.
Also mention that business metrics matter. A forecasting model is useful only if it improves inventory decisions.
9. Dynamic Pricing System
A dynamic pricing system recommends prices or discounts based on demand, supply, inventory, and business goals.
The goal is to balance revenue, conversion, margin, inventory, and customer trust. Since pricing affects user experience, fairness, brand value, and legal risk, the system needs strong guardrails.
Problem Statement
Design a system that dynamically recommends prices or discounts for products or services.
The system should use demand, supply, inventory, competitor prices, customer behavior, and business constraints. It should also include guardrails so that prices do not change in unsafe or unfair ways.
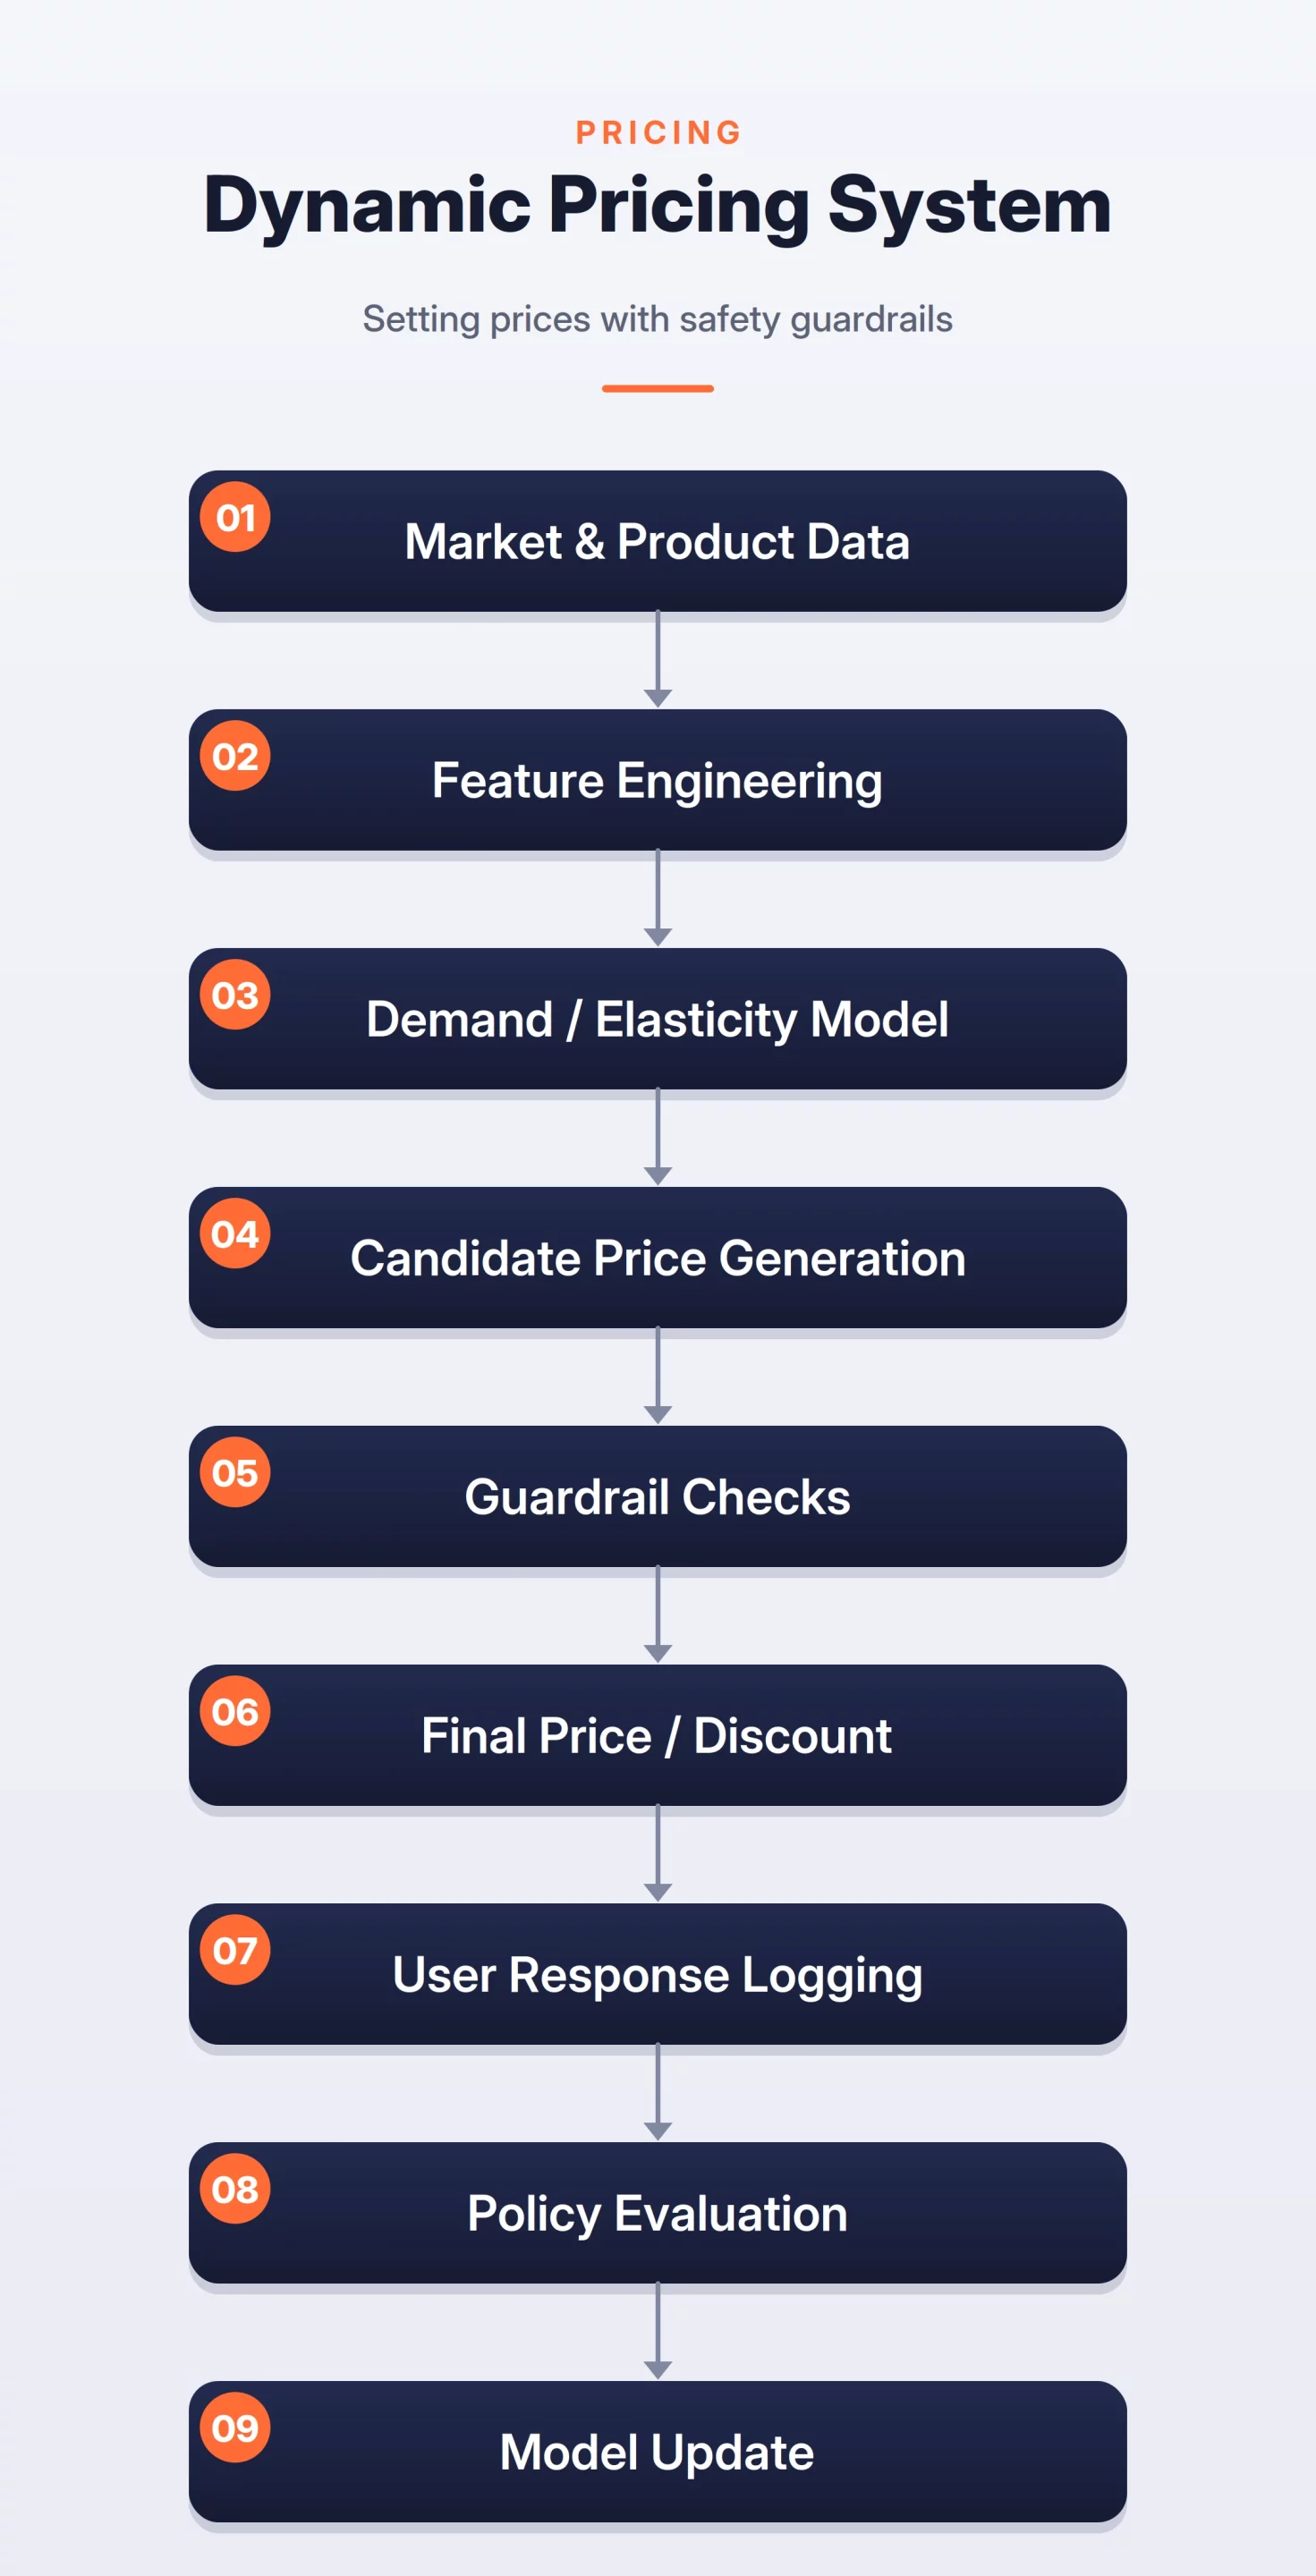
How the System Works
The system can be broken into three steps:
- Signal Collection: Collect demand, stock levels, competitor prices, historical conversions, seasonality, and margin data.
- Price Estimation: Estimate demand at different price points and generate possible prices or discounts.
- Guardrails and Feedback: Apply business, legal, fairness, and margin guardrails, show the final price, and log user actions for future training.
Dynamic Pricing Flow
Important Signals
The model should use signals that explain demand and willingness to buy.
Useful signals include:
- Current demand
- Inventory level
- Competitor price
- Historical conversion rate
- Price and discount history
These signals help the system understand when a price change may help. For example, if inventory is high and demand is low, a discount may improve sell-through. If demand is already high and inventory is limited, a discount may not be needed.
Model Choice
A good baseline is a supervised model that predicts conversion or demand for a given price. This is easier to build and safer than directly letting a model choose prices.
Once the system is stable, contextual bandits can be used for controlled exploration. They help the system learn which price works best in different contexts.
Full reinforcement learning should not be the first choice. It needs strong simulation, enough data, and strict safety controls. Without these, it can make risky pricing decisions.
Evaluation Metrics
Offline metrics include demand prediction error, conversion prediction error, and policy simulation performance.
Online metrics include revenue, margin, conversion rate, inventory sell-through, customer complaints, and price volatility.
It is also useful to track fairness and trust-related metrics. If users feel prices are random or unfair, the system may hurt long-term loyalty.
Trade-offs
The main trade-off is short-term revenue versus long-term trust. A high price may increase margin now, but it can reduce repeat purchases if users feel treated unfairly.
There is also a trade-off between exploration and risk. The system needs to test prices to learn, but too much experimentation can harm user experience.
Another trade-off is automation versus control. Fully automated pricing can react quickly, but business teams often need guardrails and approval workflows.
Interview Tip
In an interview, always mention guardrails. Dynamic pricing is not just a prediction problem. It is a decision system with business, legal, and fairness constraints.
Also mention that the model should start by predicting demand or conversion before moving toward automated price optimization.
10. RAG-Based Customer Support Assistant
A RAG-based customer support assistant answers user questions using company documents across help centers, SaaS products, banking apps, and e-commerce platforms.
The goal is to provide accurate, grounded answers rather than relying solely on the LLM’s memory. By retrieving relevant documents before generating a response, the system becomes more reliable and easier to audit.
Problem Statement
Design a customer support assistant that can answer user questions using product docs, FAQs, policies, manuals, and past support content.
The system should retrieve relevant information, generate grounded answers, cite sources, and escalate uncertain cases to a human agent.
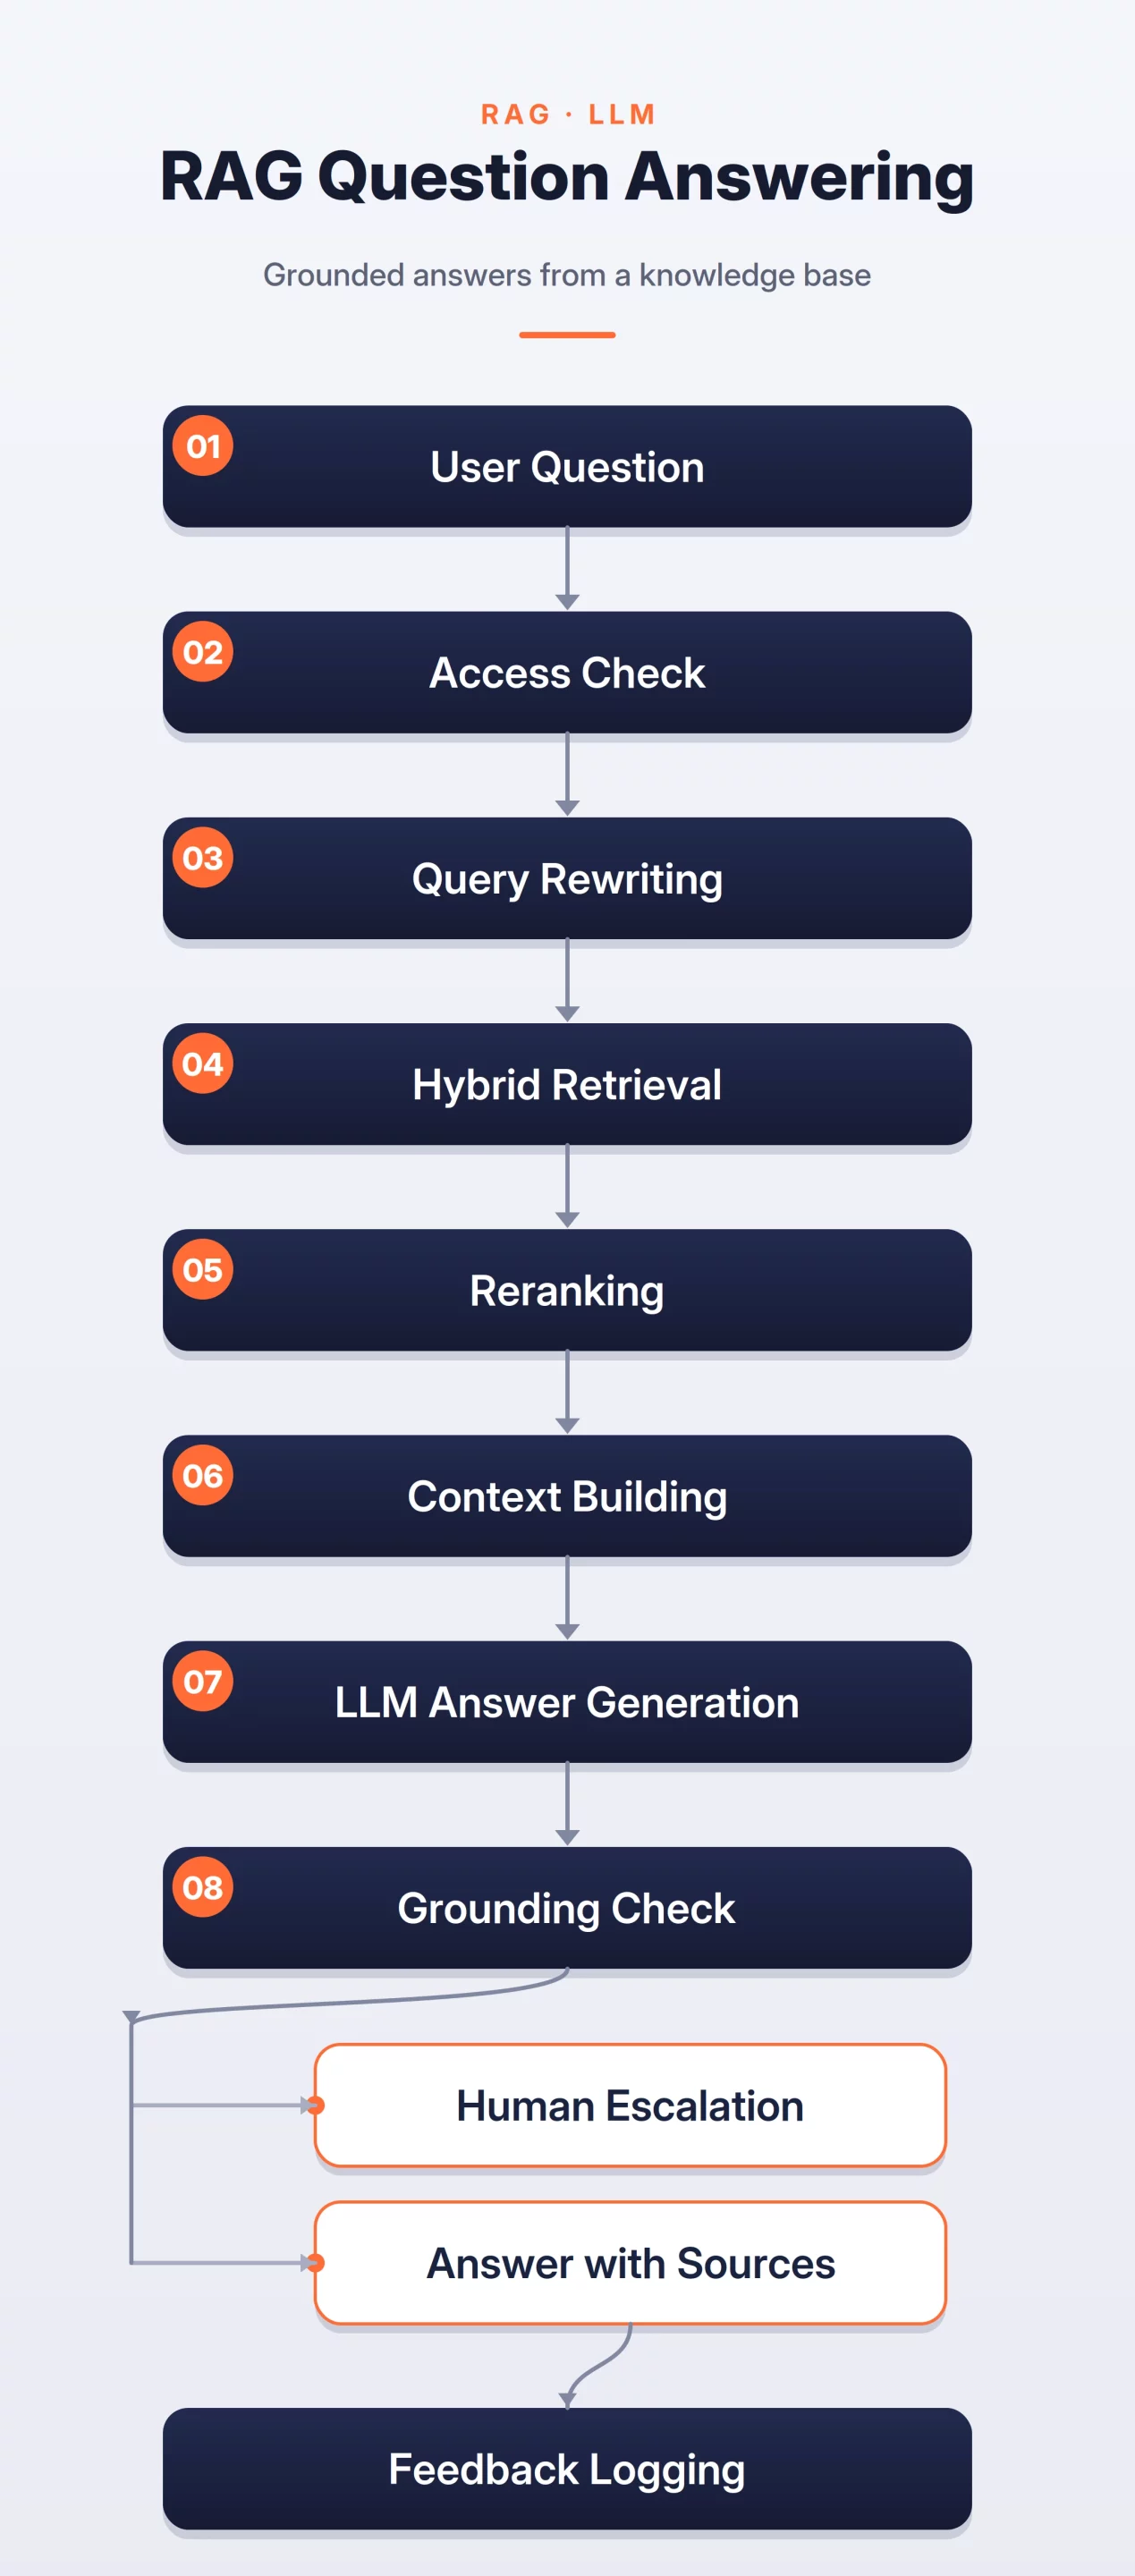
How the System Works
The system can be broken into three steps:
- Document Ingestion: Collect, clean, chunk, embed, and store documents with metadata such as source, update date, product name, and access permissions.
- Query and Retrieval: Check access rules, clean the user query, and retrieve relevant chunks using hybrid search with both keyword and vector retrieval.
- Answer Generation: Pass retrieved chunks to the LLM, generate an answer from the provided context, and ask for clarification or escalate if the context is weak.
RAG Support Assistant Flow
Important Signals
The system should use signals from the query, documents, and user context.
Useful signals include:
- User question
- Product or account type
- Document title
- Document freshness
- Chunk relevance score
Freshness is important. A support assistant can give wrong answers if it retrieves outdated policy documents.
Model Choice
The system needs three main model components.
- Embedding model: It converts document chunks and user queries into vectors.
- Reranker: It improves the order of retrieved chunks before they are sent to the LLM.
- LLM: It generates the final answer from the retrieved context.
A simple baseline can use keyword search plus an LLM. A stronger system can add vector search, reranking, better chunking, and grounding checks.
Evaluation Metrics
Evaluation should cover both retrieval and generation.
- Retrieval metrics include recall@K, MRR, and hit rate. These show whether the right document appears in the retrieved results.
- Generation metrics include answer correctness, groundedness, citation accuracy, hallucination rate, and refusal quality.
- Product metrics include resolution rate, escalation rate, average handling time, customer satisfaction, and repeat contact rate.
Trade-offs
The main trade-off is answer quality versus cost. More context can improve the answer, but it increases token usage and latency.
There is also a trade-off between strict grounding and helpfulness. If the system is too strict, it may refuse too often. If it is too loose, it may hallucinate.
Another challenge is access control. The assistant should only retrieve and answer from documents the user is allowed to see.
Interview Tip
In an interview, say clearly that retrieval quality is often more important than the LLM itself. If the wrong chunks are retrieved, even a strong LLM will produce a weak answer.
Also mention source citations, access control, document freshness, and human escalation. These are key parts of a production RAG system.
Final Interview Checklist
Before you end any ML system design answer, quickly check whether you covered the full system. This helps you avoid giving a model-only answer.
- Define the Goal: Explain what decision the system makes and why it matters.
- Understand the Data: Describe data sources, label creation, and label availability.
- Choose the Model: Start with a simple baseline and discuss possible improvements.
- Design the Serving Flow: Explain feature lookup, inference, and how predictions are used.
- Handle Production Concerns: Cover business rules, latency, logging, and fallback mechanisms.
A short checklist can help you structure the answer:
- Product goal
- Functional and non-functional requirements
- Data sources and labels
- Feature engineering
- Baseline model
This checklist is useful for every problem. It works for ranking, classification, forecasting, computer vision, pricing, and RAG systems.
The main idea is simple. Do not stop after choosing a model. Show how the model fits into a complete production system.
Hi, I am Janvi, a passionate data science enthusiast currently working at Analytics Vidhya. My journey into the world of data began with a deep curiosity about how we can extract meaningful insights from complex datasets.


