Object detection using models from Hugging Face enables developers to identify and locate objects within images by drawing bounding boxes and assigning labels. With pretrained transformer and vision models, it becomes easy to build computer vision applications without training models from scratch.
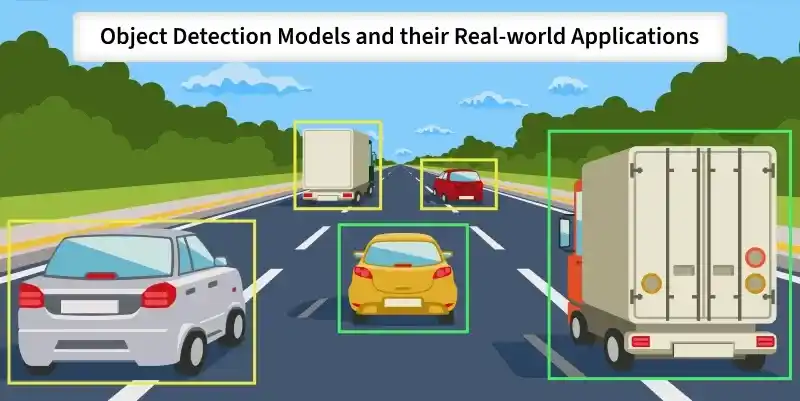
For example, in a street image, an object detection system can detect cars, traffic lights, pedestrians
Implementation of Object Detection
Step 1: Set Up the Environment
First, install the required libraries. Run the following command in your command prompt.
pip install transformers torch pillow matplotlib
Step 2: Import Required Libraries
from transformers import pipeline
from PIL import Image
import matplotlib.pyplot as plt
import matplotlib.patches as patches
Step 3: Initialize Object Detection Pipeline
This code initializes an object detection model using the pipeline API.
- task="object-detection" : Specifies that we want to perform object detection on images.
- model="facebook/detr-resnet-50" : Loads a pre trained DETR model (Detection Transformer) with a ResNet-50 backbone, trained to detect common objects.
detector = pipeline(
    task="object-detection",
    model="facebook/detr-resnet-50"
)
Output:

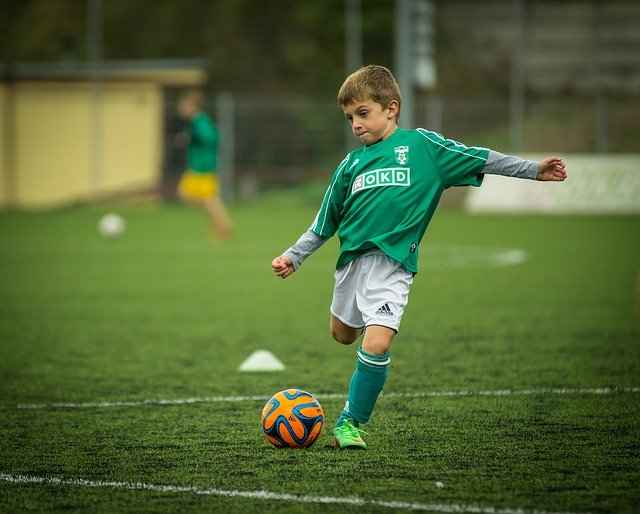
Step 4: Load and Display Image
This opens the image file and displays it using Matplotlib, confirming that the image has been loaded correctly before running object detection.
You can download the image from here
image = Image.open("your image path")

plt.imshow(image)
plt.axis("off")
plt.show()
Output:
Step 5: Run Detection
Each detected object includes:
- label: Predicted object class
- score: Confidence score
- box: Bounding box coordinates (xmin, ymin, xmax, ymax)
These results show what objects were detected and where they are located in the image.
results = detector(image)

for obj in results:
    print(obj)
Output:

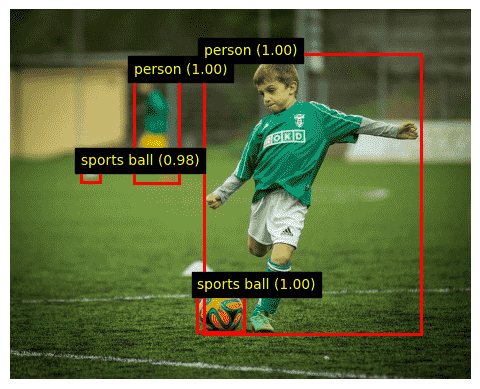
Step 6: Visualize Bounding Boxes Properly
This code draws bounding boxes around each detected object and displays the label with its confidence score directly on the image.
- Clearly visualizes detected objects
- Handles detection results in a structured way
- Clean and practical for real world applications
fig, ax = plt.subplots(1)
ax.imshow(image)

for obj in results:
    box = obj["box"]
    xmin, ymin = box["xmin"], box["ymin"]
    xmax, ymax = box["xmax"], box["ymax"]

    width = xmax - xmin
    height = ymax - ymin

    rect = patches.Rectangle(
        (xmin, ymin),
        width,
        height,
        linewidth=2,
        edgecolor="red",
        facecolor="none"
    )

    ax.add_patch(rect)
    ax.text(
        xmin,
        ymin,
        f"{obj['label']} ({obj['score']:.2f})",
        color="yellow",
        fontsize=10,
        backgroundcolor="black"
    )

plt.axis("off")
plt.show()
Output:
You can download the full code from here
