Have you ever found yourself wanting to pull the hood up on your favorite website? If you're a web developer, web designer, or just interested in the technologies of the Web, then this "Inspect Elements" feature can really get to be very informative.

This article will walk you through how to use Inspect Element on Chrome, Safari, and Firefox, covering every aspect in detail so that using and understanding this powerful tool will be easy for you.
Table of Content
- What is Inspect Element in Web Browsers?
- Why Use Inspect Element?
- How to Use Inspect Element in Chrome
- How to Use Inspect Element in Safari?
- Enable the Develop Menu in Safari
- Steps to Open Inspect Element in Safari
- Exploring Safari Web Inspector
- How to Use Inspect Element in Firefox?
- Common Features of Inspect Element
What is Inspect Element in Web Browsers?
Inspect Element is a feature in modern browsers that lets you see and change any webpage's HTML and CSS in real time. This is one important feature in web development and design for debugging, testing, and enhancing one's web page, probably available in most modern browsers like Chrome, Safari, and Firefox. HTML is an abbreviation and stands for HyperText Markup Language. HTML is the standard language used in creating web pages. CSS stands for Cascading Style Sheets and describes the visual style of those HTML elements, either on screen, paper, or any other medium. Inspect Element allows the user to view the outline and style of a webpage, and therefore gives the user an idea of the webpage's design and functionality.
Why Use Inspect Element?
Using Inspect Element can be beneficial for several reasons:
1. Debugging
Inspect Element is a tool that enables the user to discover mistakes in HTML, CSS, and JavaScript so that they can be rectified. Suppose you have an element that doesn't show the way you want, then this facility is what you use to find out if a certain element is hidden by some CSS or if there is some error in the HTML structure of the element.
2. Plan
With Inspect Element, the web designer can test and try different styles and layouts. You could alter colors, fonts, and other CSS properties quickly and see immediately how changes are going to affect the design without changing code.
3. Learning
As for beginners, it only gives you the chance to really understand how websites are built. It gives you a proper view on how different elements of a website are arranged and styled. This is actually a good way to learn it.
4. Examination
Web developers constantly require the testing of their websites for process correctness with different browsers and devices. Inspect Element makes it possible to test it really quick and then make corrections when necessary.
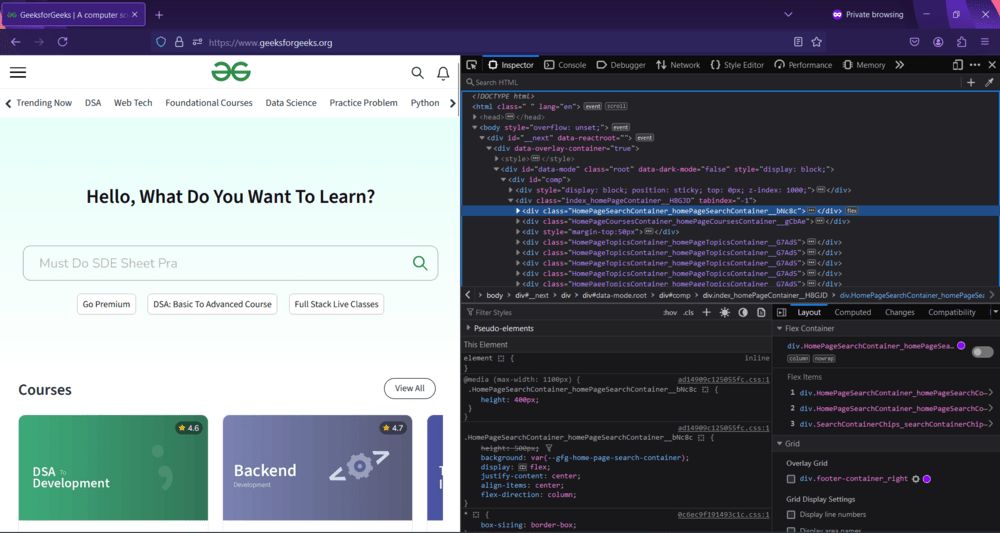
How to Use Inspect Element in Chrome
Chrome Developer Tools, or DevTools, offer web developers a gigantic, capable box of doo-dads to look through, debug, and analyze web pages. Here's how one goes through the process of navigating and putting the Inspect Element capability in Chrome's DevTools to use:
Steps to Open Inspect Element in Chrome
- Right-Click Method: Right-click anything on the page and select 'Inspect Element' from the context menu. This will open DevTools' Elements panel to the element's DOM.
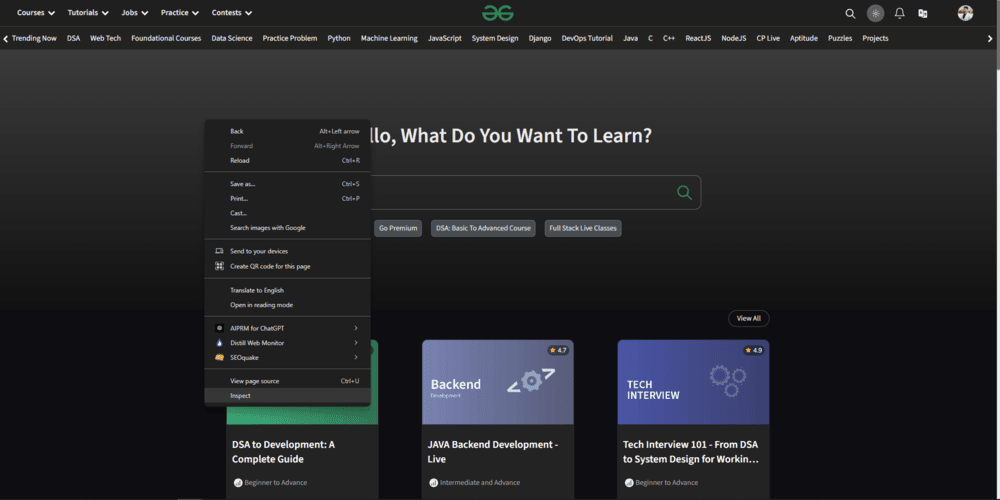
- Keyboard Shortcut: Press Ctrl+Shift+I (Windows/Linux) or Cmd+Option+I (Mac). This shortcut.
- Navigate: Open Chrome and click on the three dots at the top right, then on "More tools," and finally on "Developer tools."
Exploring Chrome Developer Tools
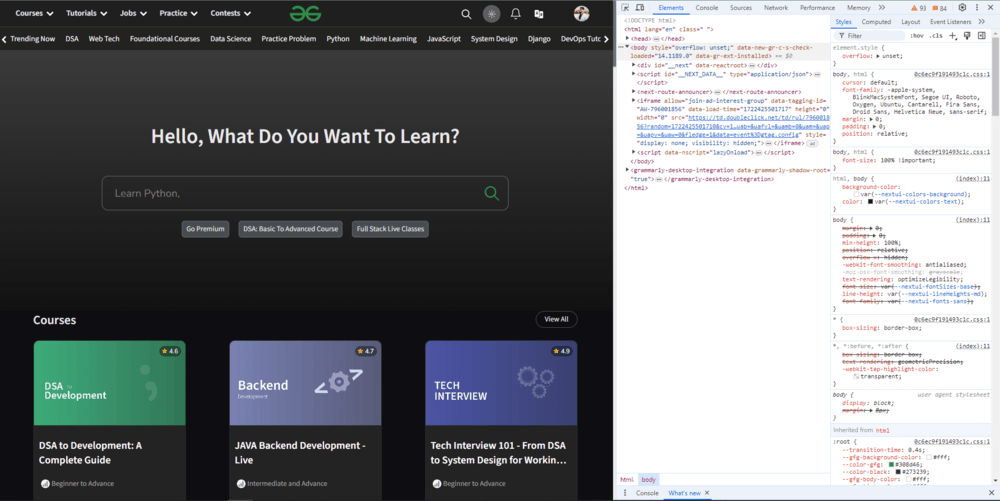
1. Elements Panel
The Elements panel exposes the HTML structure of the web page and its associated CSS. You can live-edit the elements directly and see the result without the need to save or refresh the document. Right-click on any HTML tag within the panel to have all the options to add, edit, or remove attributes or styles.
2. Console Panel
This is an area from which the console panel is run to test the JavaScript codes, get to know the errors' messages, and log information. It's rather helpful for script testing and debugging.
3. Network Panel
The Network panel shows you all requests a web page sends over the network. This allows for the simulation of network load times, error checks, and performance optimizations.
4. Performance Panel
The performance panel is used to analyze load time, rendering, and complete performance on the webpages. Users can record the performance session and get deep breakdowns of where the time is being spent.
5. Source Panel
The Source panel gives you a possibility to inspect and debug your JavaScript code: set breakpoints, virtually execute your code line by line, and examine code variables to find some trouble you may have with JavaScript.
6. Application Panel
The Application panel is used for general storage viewing, such as Cookies, Local Storage, and Session Storage. It helps organize and debug the data your web application has saved.
7. Security Panel
The Security panel gives information on the status about the web page security, SSL/TLS, and security-related errors.
How to Use Inspect Element in Safari?
Safari's Web Inspector is equivalent to Chrome's DevTools if you need to check something out within the environment of the Safari browser. Here is how you can access and use Inspect Element in Safari:
Enable the Develop Menu in Safari
- Open Safari Preferences: Choose Safari in the menu bar > Preferences.
- Advanced Tab: Check the box next to "Show Develop menu in menu bar." Now the Develop menu has been activated—that gives the ability to use Safari's Web Inspector.
Steps to Open Inspect Element in Safari
- Right-Click the Page Element: Right-click on any page element and select "Inspect Element" from the context menu. This will open the Web Inspector with the element that was selected.
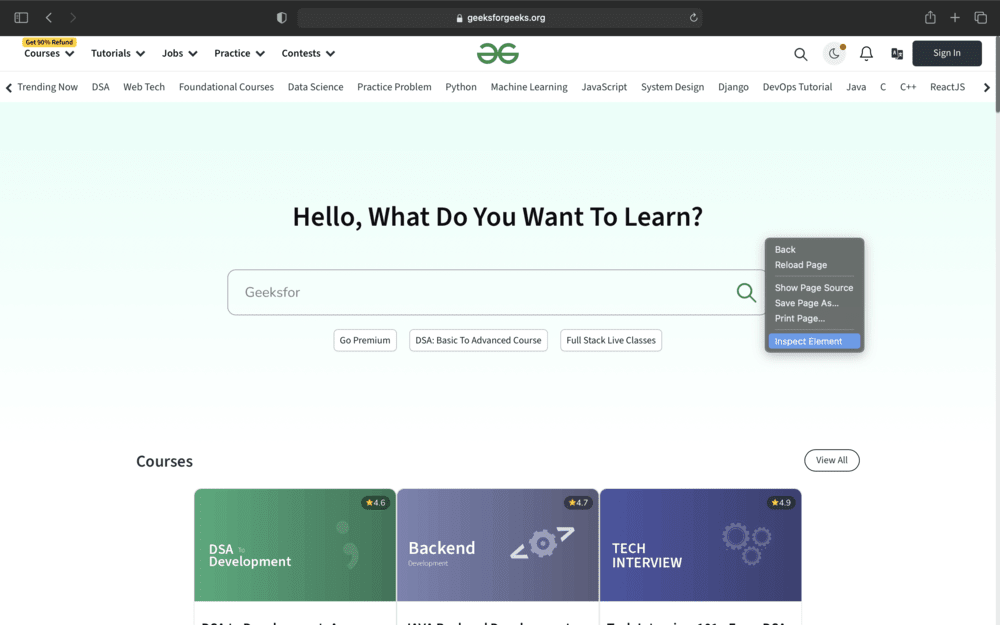
- Keyboard Shortcut: Open Web Inspector via Cmd+Option+I without any further delay.
- Develop Menu: Go to Develop > Show Web Inspector in the menu bar. This method will be very helpful if you belong to the 'Menu' type of users.
Exploring Safari Web Inspector
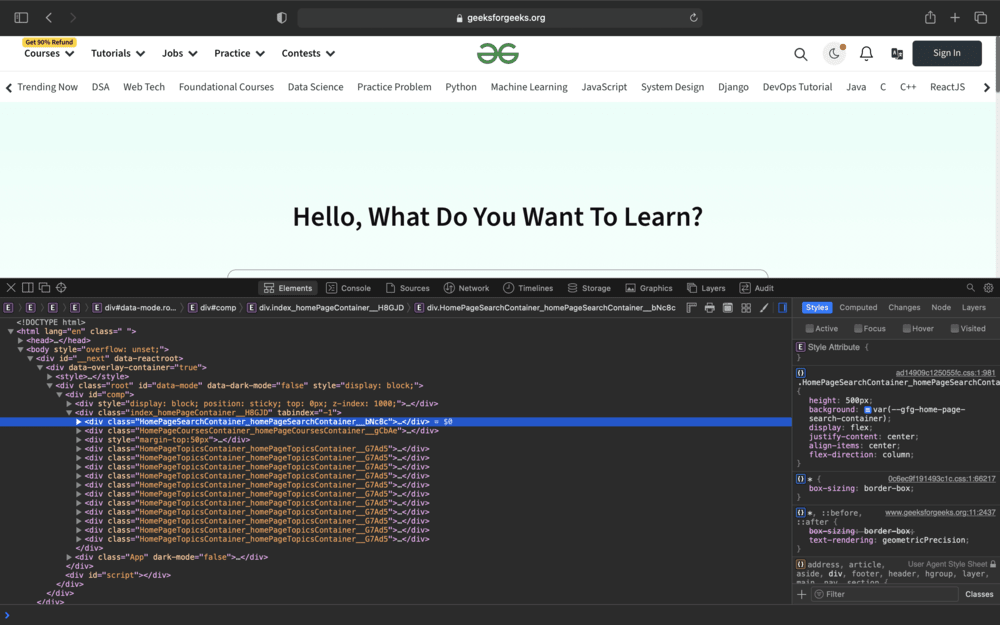
1. Elements Tab
Where you are given the HTML structure of the page and CSS styles applied to elements. You can edit these elements inline, just as in Chrome.
2. Console Tab
The Console tab can be worked on to run some JavaScript code and to look at several different logs and errors. It can be more useful when testing and debugging scripts.
3. Network Tab
The Network tab displays all network requests that are created by the webpage with resources and load times. It becomes helpful during the optimization of performance and problems debugging.
4.Resources Tab
The Resources tab is used to gain access to the data saved by the web page, such as cookies, local storage, and session storage.
5.Timelines Tab
The Timelines tab will help you to measure and analyze the performance of your webpage. With it, you can get the exact loading times as well as a complete rendering performance breakdown.
6. Storage Tab
It is the place where cookies, local storage, and session storage can be viewed and controlled as it is specifically done in the Application panel in Chrome.
How to Use Inspect Element in Firefox?
Firefox comes with a complete set of checking and debugging facilities for web pages. Inspect Element in Firefox can be accessed and used by performing the following steps:
Steps to Open Inspect Element in Firefox
- Right Click Method: Right-click any element on the web page and then choose 'Inspect Element', that should have opened the Inspector Panel with that element pre-selected.

- Keyboard Shortcut: The hotkey Ctrl+Shift+I (Windows/Linux) and Cmd+Option+I (Mac) opens up the Inspector panel view.
- Accessing the Menu: Use the three lines located at the top right in Firefox. This will display a drop-down, where you should click on "Web Developer," leading to "Inspector." This is a bit helpful when you rely more on navigating through the menus rather than the settings.
Exploring Firefox Web Developer Tool Commands
1. Inspect Panel
The Inspect panel shows the HTML structure of a webpage and CSS styles. You can edit in real-time the elements within, similar to acting in real time with Chrome, Safari, and localhost.
2. Console Panel
The Console panel offers various facilities to a user: executing JavaScript code, displaying logs, and catching errors, which is very useful when spinning out scripts.
3. Debugger Panel
Allows viewing and debugging of JavaScript code. One can establish breakpoints, go line by line through the source code, and check variables.
4. Network Panel
A Network panel extorts web pages, offering a list of all the network requests, resource sizes, times, and possible errors in loading.
5. Performance Panel
The Performance panel is used to analyze loading activities, rendering, and other performances on the page. Record a performance session and you can see a detailed breakdown of where it's spending the time.
6. Storage Panel
The Storage Panel provides you access to the data stored by the page: cookies, local storage, and session storage.
7. Accessibility Panel
Inspect the accessibility of roles, properties, and labels in your webpage to check for accessibility.
Common Features of Inspect Element
Tools to inspect elements are very common, with most of them having quite a few attributes in common that render them highly useful to not only web developers but also to designers.
1. HTML and CSS Editing
The ability to view and adjust HTML and CSS in real time with Inspect Element is what truly makes it so powerful. This comes in handy during tasks such as debugging, layout examination, or prototyping changes so as to save one actual time editing the code on the site. For example, one could change the color of a particular button, increase its font size, or even alter some layout just to view the impact it causes to the design.
2. JavaScript Console
The console is such a helpful, powerful means of running JavaScript through code debugging and logging. It allows you to run JavaScript code right on the console, present error messages, and log information. This helps you identify and rectify issues in your scripts.
3. Network Monitoring
The network panel details every network request made from the webpage, including the sizes of the files and their load times, and the HTTP status codes returned. You can use this to watch all resources load, look for errors, and check to make sure your site is running as quickly as possible — say, for example, an image taking too long to load or a script not loading.
4. Performance Analysis
Use performance tools for analyzing the load time, rendering, and the page's performance. You can record the session performance and then display time spent. This would help you identify bottlenecks and improve user experience.
5. Responsive Design Mode
Responsive design mode allows one to see how their webpage will look on different devices and screen sizes. This means you can simulate several screen resolutions, orientations, and user agents. It is important in recent times for creating a responsive site viewable best on different sides of the devices due to the variation in user access to websites.
Conclusion
Inspect Element is an amazingly multipurpose tool useful for practitioners in web development or design at any level, even with just the slightest involvement. Whether debugging code, testing out some new design, or just looking at how others did something on their website, all that is truly doable with Inspect Element in Chrome, Safari, and Firefox. The following article should provide you with all the information you need to access and utilize your all-powerful Inspect Element.
Also Read:
