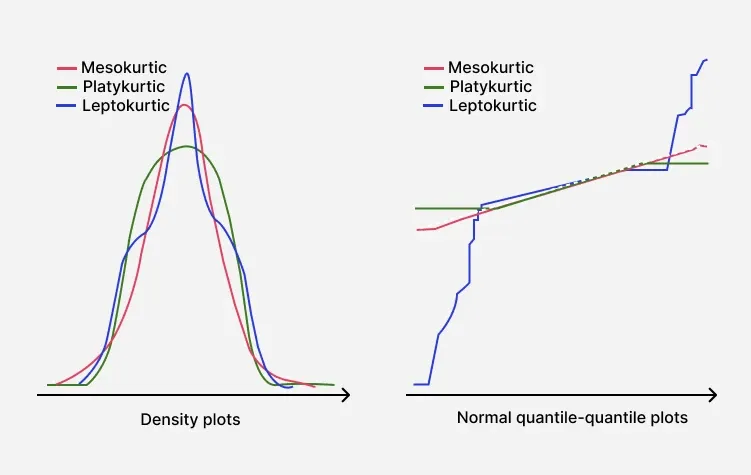
Kurtosis is a statistical parameter characterizing the shape of a probability distribution, and it focuses on the behavior of its tails. Kurtosis determines if a distribution has extreme values more or less than a normal distribution. Distributions are differentiated based on kurtosis as leptokurtic, mesokurtic and platykurtic. A platykurtic distribution will have lighter tails than a normal distribution, with fewer extreme values and a more level spread of data. This means that extreme deviations from the mean are less likely to be seen.
Understanding Kurtosis
Kurtosis is defined as the fourth central moment of a distribution, standardized by the square of the variance. The mathematical formula for kurtosis is:
\text{Kurtosis} = \frac{\frac{1}{n} \sum_{i=1}^{n} (x_i - \mu)^4}{\left(\frac{1}{n} \sum_{i=1}^{n} (x_i - \mu)^2\right)^2}
Where:
- n is the total number of observations.
- xi is the i-th value in the dataset.
- μ is the mean of the data.
Characteristics of Platykurtic Distributions
A platykurtic distribution possesses a kurtosis of less than 3 (the kurtosis of the normal distribution). This means that the distribution will have flatter peaks and more slender tails than a normal (Gaussian) distribution. Key characteristics include:
1. Flatter Peak: The peak of the distribution is broader and less pronounced, suggesting that most values lie closer to the mean.
2. Thin Tails: The tails of the distribution taper off quickly, indicating fewer extreme values or outliers in the data.
3. Low Kurtosis Value: Since the kurtosis value is less than 3, the distribution shows less probability of producing extreme deviations.
4. Even Distribution: The spread of values tends to be more uniform across the range, resulting in a more consistent pattern of observations.
Examples of Platykurtic Distributions
1. Uniform Distribution: The uniform distribution is a very typical platykurtic distribution in which all the outcomes have similar probabilities, and the tails are very thin.
2. Beta Distribution (Certain Parameters):If the beta distribution is parameterized for certain parameters that build flat peaks, this will cause it to have a platykurtic shape.
3. Binomial Distribution (Large n, p near 0.5): In cases where the binomial distribution approximates a uniform-like spread, it can exhibit platykurtic behavior.
Mathematical Interpretation
A platykurtic distribution has a kurtosis value:
Kurtosis < 3
If we consider a dataset with observed values, the kurtosis can be computed using Python.
import numpy as np
from scipy.stats import kurtosis

data = [12, 14, 15, 17, 19, 20, 21, 23, 25, 28, 30]

# Calculating kurtosis
kurt = kurtosis(data)
print(f"Kurtosis: {kurt:.4f}")

# Checking if the distribution is platykurtic
if kurt < 3:
    print("The distribution is platykurtic (low kurtosis).")
elif kurt == 3:
    print("The distribution is mesokurtic (normal kurtosis).")
else:
    print("The distribution is leptokurtic (high kurtosis).")
Output
Kurtosis: -1.0080
The distribution is platykurtic (low kurtosis).
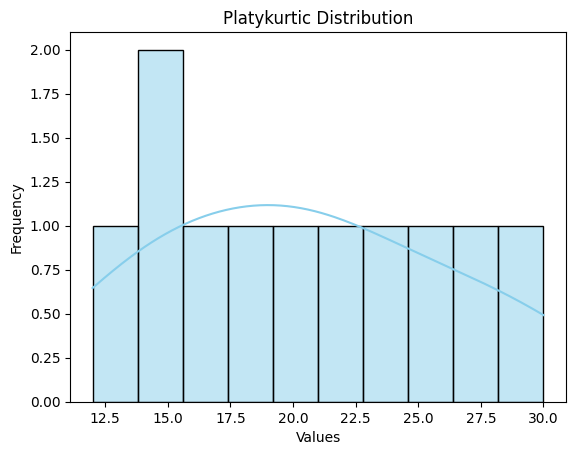
Visual Representation
To visualize a platykurtic distribution, you can plot the data to observe its flat peak and thin tails:
import matplotlib.pyplot as plt
import seaborn as sns

# Plotting the distribution
sns.histplot(data, kde=True, color='skyblue', bins=10)
plt.title('Platykurtic Distribution')
plt.xlabel('Values')
plt.ylabel('Frequency')
plt.show()
Output
Comparison with Other Distributions
Distribution Type | Kurtosis Value | Tails | Peak Shape |
|---|---|---|---|
Leptokurtic | > 3 | Heavy tails | Sharp, narrow peak |
Mesokurtic | = 3 | Normal tails | Bell-shaped peak |
Platykurtic | < 3 | Light tails | Flatter, broad peak |
Advantages of Platykurtic Distributions
- Reduced probability of extreme values, making data more consistent.
- Ideal for processes requiring uniformity and stability, such as quality control in manufacturing.
- Less sensitive to outliers, which helps in fields like risk management and experimental analysis.
- Better for modeling real-world data where extreme fluctuations are unlikely.
Disadvantages of Platykurtic Distributions
- Can underestimate the probability of extreme events, which may be crucial in financial or risk analysis.
- May over-simplify the shape of the data in highly variable systems to the extent of making incorrect conclusions.
- Isn't appropriate for data sets where rare but serious events are possible, like stock market collapses or natural catastrophes.
- Can miss significant detail in some types of data, making it not so useful in predicting models.
