A violin plot in Seaborn is a powerful visualization tool, offering insights into data distributions. By default, the width of each violin plot is uniform. However, Seaborn provides various customization options to adjust the widths, enabling you to highlight different aspects of the data, such as the number of observations or variations in density. In this article, we’ll explore how to customize violin plot widths using different Seaborn parameters.
Table of Content
Why Customize Violin Plot Width?
Customizing the width of violin plots can improve how the data is displayed. Sometimes, default widths do not provide clear distinctions between categories, making it hard to interpret the distribution.
Therefore, adjusting widths based on data or specific preferences can lead to more effective visualizations.
Understanding the width Parameter in Seaborn
The width parameter controls the maximum width of each violin. By default, this value is set to 0.8, meaning each violin will take up 80% of the available space.
You can easily modify the width of violins using the width parameter. For example:
import seaborn as sns
import matplotlib.pyplot as plt
tips = sns.load_dataset('tips')
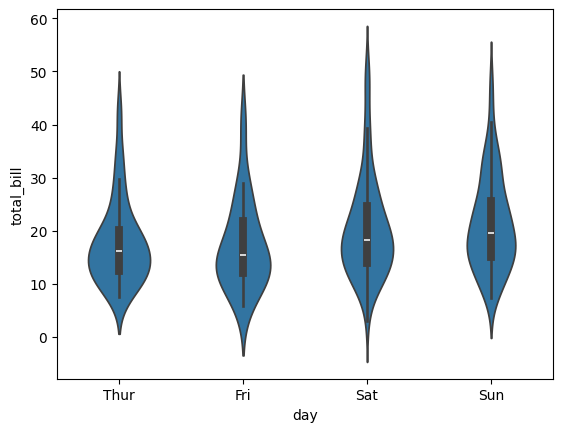
sns.violinplot(x="day", y="total_bill", data=tips, width=0.5)
plt.show()
Output:
Adjusting the Violin Width Using Scale
Seaborn provides the scale parameter, which adjusts the violin width based on various criteria:
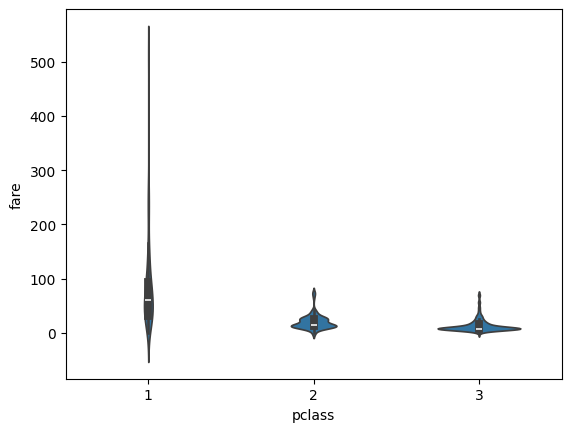
1. Scale Width Based on Number of Observations ('count')
When you set scale="count", the width of each violin plot will be proportional to the number of observations in each category.
sns.violinplot(x="pclass", y="fare", data=df, scale="count")
plt.show()
Output:
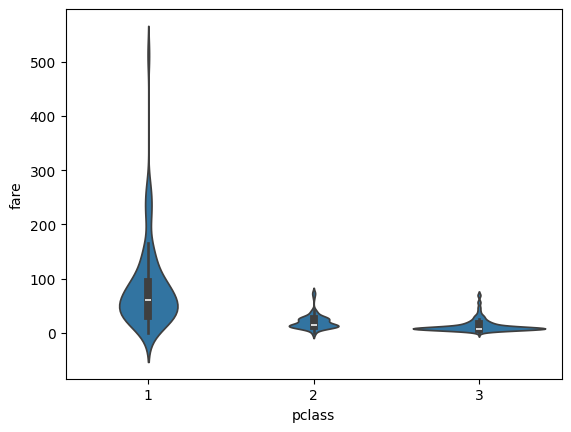
In this plot:
- The violins will vary in width based on how many data points each category contains.
- For example, if there are more passengers in the 3rd class than in the 1st class, the 3rd class violin will be wider.
2. Uniform Width for All Violins ('area')
By default, scale="area" ensures that all violins have the same area, but their widths may differ based on the distribution density. This is the default setting for Seaborn violin plots.
sns.violinplot(x="pclass", y="fare", data=df, scale="area")
plt.show()
Output:
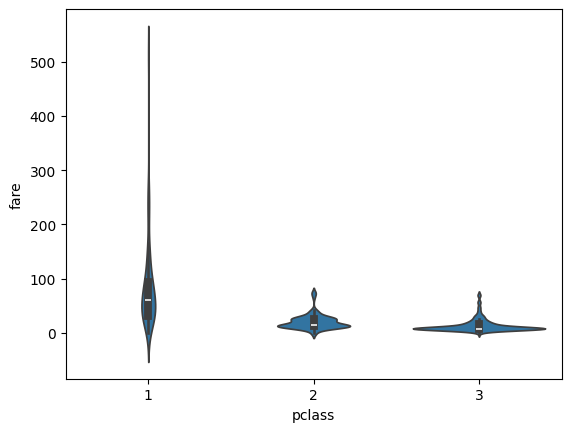
In this mode, the violins' widths will adjust to ensure each plot has the same area, but narrower parts indicate fewer observations.
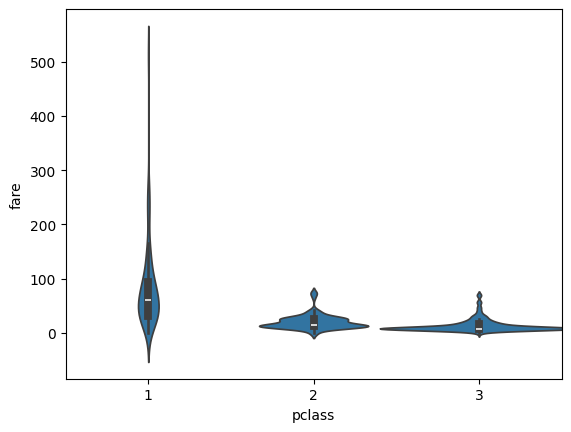
3. Constant Width for All Violins ('width')
If you want the violins to have the same width regardless of the number of observations, you can set scale="width".
sns.violinplot(x="pclass", y="fare", data=df, scale="width")
plt.show()
Output:
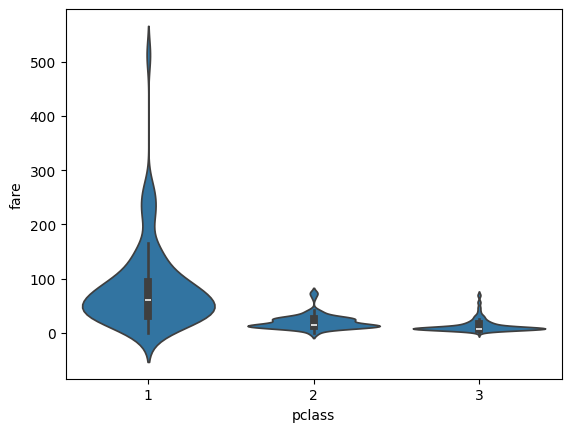
This creates violin plots with a constant width across all categories, which can help when focusing solely on distribution shapes without comparing the number of observations.
Adjusting the Width Manually
You can also manually control the width of the violins using the width parameter. The default value is 0.8, but you can increase or decrease it as needed.
Example 1: Decrease Width
sns.violinplot(x="pclass", y="fare", data=df, width=0.5)
plt.show()
Output:
Here, the violins are narrower than the default, making them more compact.
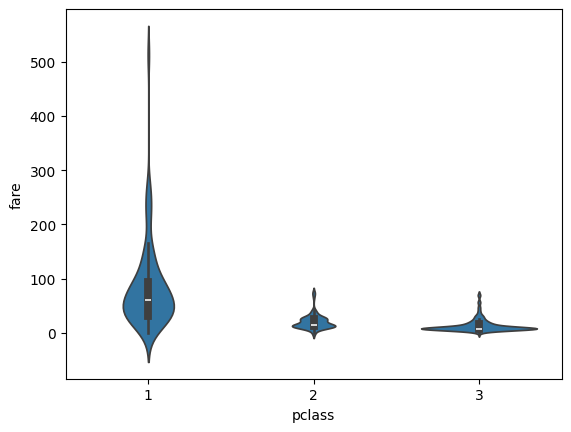
Example 2: Increase Width
sns.violinplot(x="pclass", y="fare", data=df, width=1.2)
plt.show()
Output:
Increasing the width makes the violins larger, which can help in visualizing small differences in the distributions.
Combining Scale and Width in Violin Plot
You can also combine the scale and width parameters for more precise control over the violin plot appearance.
For example, to use a scale="count" and reduce the default width:
sns.violinplot(x="pclass", y="fare", data=df, scale="count", width=0.7)
plt.show()
Output:
In this plot, the violins are scaled by the number of observations but are narrower overall, providing a balanced view of both distribution density and count.
Controlling Width for Multiple Categories
When plotting multiple categories, it's often useful to control the width of violins individually. Seaborn doesn’t allow direct control over individual violin widths, but you can split the plot or create multiple violin plots.
Example: Grouping by Sex and Day
sns.violinplot(x="day", y="total_bill", hue="sex", data=tips, split=True, width=0.8)
plt.show()
Output:
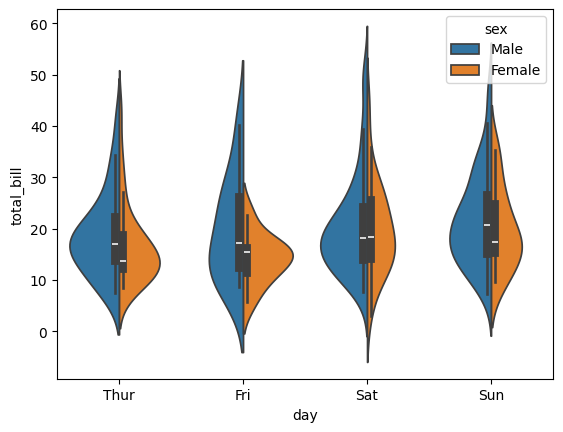
This creates a split violin plot, where the violins for male and female customers are displayed side-by-side for each day. The split=True parameter is particularly helpful when you want to compare distributions within the same category.
Conclusion
Customizing violin plot widths in Seaborn allows you to emphasize different aspects of your data, whether it’s the distribution shape, density, or number of observations in each category. Here are the key points to remember:
- scale="count": Adjust widths based on the number of observations.
- scale="area": Maintain equal area for all violins (default setting).
- scale="width": Ensure constant width for all violins.
- width parameter: Manually set violin width to fine-tune the appearance.
