CSV and Excel are two popular formats used to store and manage data, but they work very differently. CSV is a lightweight, plain-text format ideal for simple data transfer, while Excel supports formulas, formatting, charts, and advanced data analysis. Understanding their differences helps you choose the right format for speed, compatibility, or powerful data handling.
CSV (Comma Separated Values)
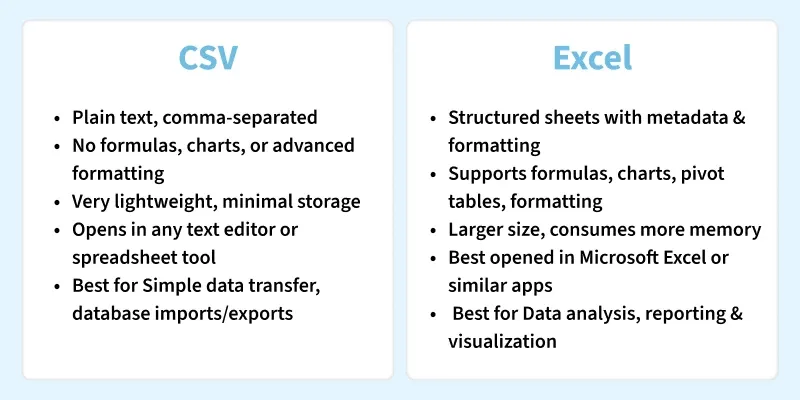
A CSV file stores data in plain text, where each value is separated by a comma and each line represents a row. Because it's simple and lightweight, CSV can be opened in any text editor and is supported by almost all programming languages. It’s widely used in data analysis, data transfer, databases, and visualization workflows due to its universal compatibility.
Key Features of CSV
- Lightweight & Fast: Very small file size; loads quickly.
- Human-Readable: Can be opened and edited using any text editor.
- Highly Compatible: Supported by Excel, Google Sheets, databases, Python, R, and more.
- No Formatting: Only raw data—no formulas, colors, or charts.
- Easy to Parse: Programming languages offer built-in CSV libraries.
Advantages of CSV
- Extremely small file size
- Easy to share across platforms
- Supports very large datasets
- Simple to parse programmatically
Disadvantages of CSV
- No data formatting
- No formulas or charts
- Harder to visually read large datasets
- Cannot store metadata
When to Use CSV
- When you need fast data transfer between apps.
- When working with programming languages (Python, R, Java, etc.).
- When you want universal compatibility across systems.
- When file size needs to be minimal.
Excel (Microsoft Excel)
Microsoft Excel is a spreadsheet software used to organize data in rows and columns, with each cell capable of storing text, numbers, or formulas. Excel supports powerful calculation tools, formatting options, and built-in functions that make data analysis, reporting, and visualization easier. It is widely used in business, finance, education, and analytics for both simple and complex data tasks.
Key Features of Excel
- Formulas & Functions: Supports hundreds of built-in functions (SUM, VLOOKUP, IF, etc.).
- Rich Formatting: Colors, borders, conditional formatting, and styles.
- Charts & Visuals: Create graphs, pivot charts, dashboards, and reports.
- Multiple Sheets: Store and manage data across several worksheets in one file.
- Data Tools: Features like pivot tables, filters, sorting, and data validation.
Advantages of Excel
- User-friendly and visually rich
- Supports formulas, charts, pivot tables
- Good for presentations and business reports
- Allows automation with VBA
Disadvantages of Excel
- Larger file size
- Requires Excel or compatible tool
- Not ideal for transferring raw data between systems
- Slower with very large datasets
When to Use Excel
- When you need data analysis, formulas, functions, or charts.
- When creating reports, dashboards, or presentations.
- When working with multiple linked sheets.
- When you need data validation or structured templates.
