Whether you’re preparing for a presentation or just want to keep your data organized, customizing your chart in Google Sheets is a simple yet effective way to enhance the readability and impact of your work.
1. How to Change Chart Labels and Title in Google Sheets
Customizing chart labels and titles in Google Sheets helps make your data visualizations more clear and meaningful. Whether you want to rename a chart title, adjust axis labels, or add data labels for better understanding, Google Sheets provides an easy way to do it. Here’s a step-by-step guide:
Step 1: Open the Google Sheet with the Chart
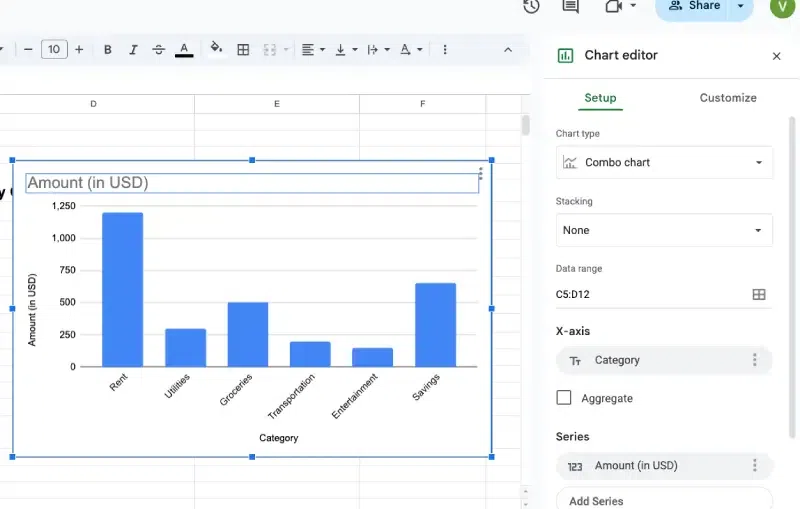
Go to the Google Sheet containing the chart you want to edit. Click on the chart to select it. This will open the Chart Editor panel on the right side.
Step 2: Edit the Chart Title
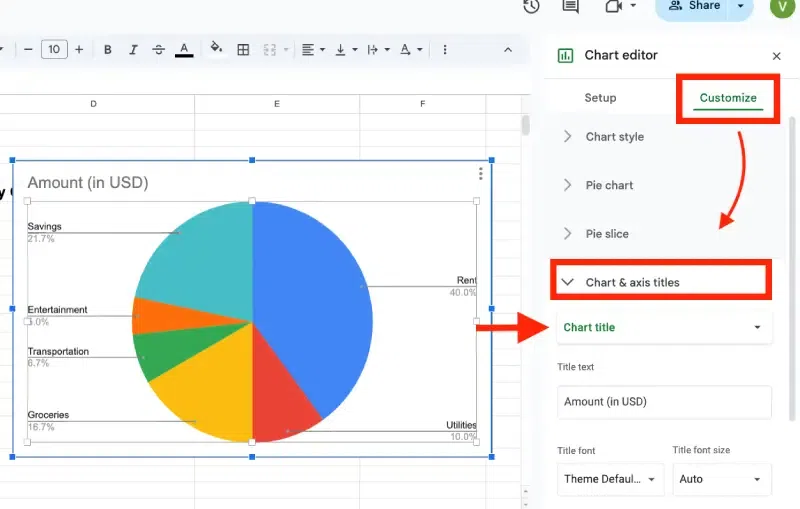
In the Chart Editor, go to the Customize tab. Click on Chart & axis titles to expand the section. From the dropdown menu, select Chart title. Edit the title text in the text box below the Title text field.
Example: Change the default title to “Quarterly Sales Performance.”
Adjust the font size, style, and color using the options under Title format for better clarity.
Step 3: Edit Axis Titles
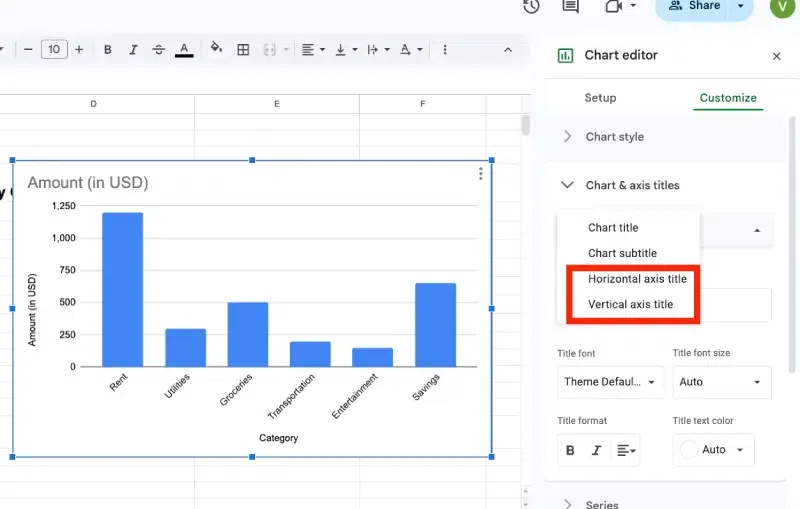
If your chart is not pie chart then you need to write x axis and y axis label. In the same Chart & axis titles section, choose Horizontal axis title or Vertical axis title from the dropdown. Enter your desired label text in the Title text field.
Example: For a sales chart, label the horizontal axis as "Months" and the vertical axis as "Sales in USD."
Customize the font style, size, and color as needed to make the labels more readable.
Step 4: Add or Customize Data Labels
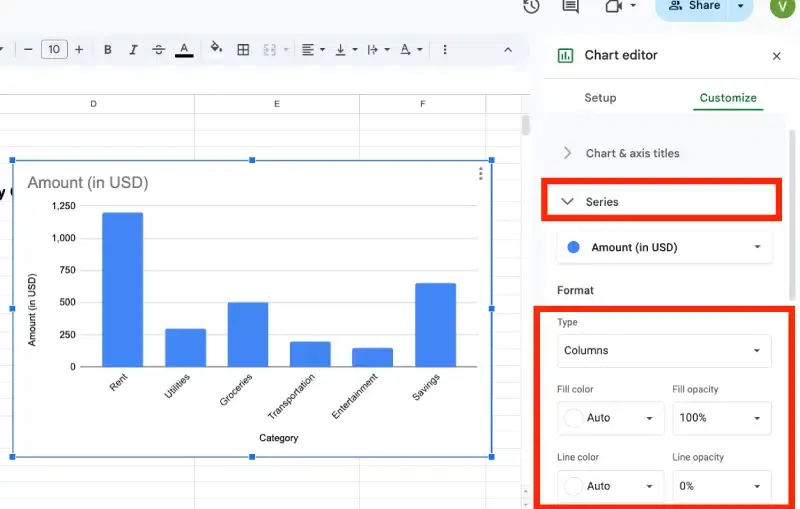
Still in the Customize tab, expand the Series section. Check the box labeled Data labels to display values directly on the chart. Adjust the position, font size, or color of the labels as needed.
Example: Position the labels inside or outside the chart elements for better visibility.
Step 5: Save and Finalize Changes
Review the chart to ensure the labels and title accurately represent your data. Resize or reposition the chart in your sheet as needed. Save your Google Sheet to retain the changes.
2. Best Practices for Chart Labels and Titles
- Be Descriptive: Ensure your titles and labels clearly explain the data being represented.
- Keep it Concise: Avoid overly lengthy titles or labels to maintain a clean appearance.
- Use Consistent Formatting: Apply the same font styles and sizes across your chart for a professional look.
By following these steps, you can effectively customize chart labels and titles in Google Sheets, ensuring your charts are both visually appealing and easy to understand.
