In the field of machine learning, knowing which characteristics (or data points) are most significant for generating predictions can be quite critical. One way to determine this is by using the "feature importance" idea, which is derived from the well-known machine learning technique CatBoost. In this article, we'll be looking at a key idea today called "CatBoost Feature Importance."
What is CatBoost?
CatBoost, short for "Categorical Boosting," is a powerful machine learning algorithm created by Yandex. It's designed to handle different types of data, including categorical data (which is non-numeric, like "red," "blue," "green") and numerical data (like 1, 2, 3). Think of CatBoost as a super-smart dog trainer. It can handle all sorts of data, just like a dog can fetch different objects. But CatBoost goes a step further. It can tell you which features (like the ball's colour or size) are most important for the dog to learn and make a successful fetch. CatBoost is known for its high performance and ease of use, making it a popular choice for data scientists and engineers. This algorithm is particularly good at handling categorical data (data that can be divided into categories) and is known for being fast and accurate.
What is Feature Importance?
Feature Importance is a technique used in machine learning to identify which features (or input variables) are most important in predicting the target variable. Feature importance is like a scorecard that tells CatBoost which features in your data are most helpful for making accurate predictions. It's like figuring out which parts of the dog's training helped it fetch the ball best. Think of features as different pieces of information you have about something. For example, if you're trying to predict the price of a house, features could include the size of the house, the number of bedrooms, and the location.
Why is Feature Importance Important?
Knowing which features are important helps us understand the data better. It allows us to:
- Focus on the most critical information.
- Simplify models by removing less important features.
- Gain insights into how different features affect the predictions.
How does CatBoost calculate feature importance?
CatBoost uses the idea of decision trees to make predictions. A decision tree is like a flowchart where each question (or split) about the data leads to a different path and eventually to a decision or prediction. To determine feature importance, CatBoost looks at how much each feature helps in making correct predictions. If removing or changing a feature significantly worsens the model’s performance, that feature is considered important.
Steps to Determine Feature Importance Using CatBoost
Let's walk through the steps needed to determine feature importance using CatBoost. In this section, we'll go through two detailed examples to demonstrate how to use CatBoost for calculating feature importance. The first example will use a synthetic dataset, and the second will use a public dataset.
Example 1: Synthetic Dataset
Step 1: Import Necessary Libraries
First, we'll import the libraries needed for this example.
pip install catboost
import pandas as pd
import numpy as np
from catboost import CatBoostRegressor, Pool
import matplotlib.pyplot as plt
import seaborn as sns
Step 2: Create a Synthetic Dataset
We will create a simple dataset with three features and a target variable.
np.random.seed(42)
size = 100  # Size of the dataset

# Generate synthetic data
X1 = np.random.rand(size) * 100  # Feature 1
X2 = np.random.rand(size) * 200  # Feature 2
X3 = np.random.choice(['A', 'B', 'C'], size)  # Feature 3 (categorical)
y = 10 + 2 * X1 + 3 * X2 + np.random.randn(size) * 10  # Target variable

# Create a DataFrame
data = pd.DataFrame({'Feature1': X1, 'Feature2': X2, 'Feature3': X3, 'Target': y})
Step 3: Prepare the Data
We'll prepare the data for training by splitting it into features (X) and the target variable (y).
X = data[['Feature1', 'Feature2', 'Feature3']]
y = data['Target']

# Encode categorical data
X['Feature3'] = X['Feature3'].astype('category')
Output:
<ipython-input-5-e5198ba70bab>:5: SettingWithCopyWarning:
A value is trying to be set on a copy of a slice from a DataFrame.
Try using .loc[row_indexer,col_indexer] = value instead

See the caveats in the documentation: https://pandas.pydata.org/pandas-docs/stable/user_guide/indexing.html#returning-a-view-versus-a-copy
  X['Feature3'] = X['Feature3'].astype('category')
Step 4: Train the CatBoost Model
We'll initialize and train the CatBoost model.
model = CatBoostRegressor(iterations=100, learning_rate=0.1, depth=3, verbose=False)
# Pass the index of the categorical feature to cat_features
model.fit(X, y, cat_features=[2])
Output:
<catboost.core.CatBoostRegressor at 0x79ec120bc8e0>Step 5: Calculate Feature Importance
We can now calculate the feature importance using the get_feature_importance method.
feature_importance = model.get_feature_importance()
feature_names = X.columns

# Display feature importance
for name, importance in zip(feature_names, feature_importance):
    print(f"Feature: {name}, Importance: {importance:.2f}")
Output:
Feature: Feature1, Importance: 18.13
Feature: Feature2, Importance: 81.82
Feature: Feature3, Importance: 0.05
Step 6: Visualize Feature Importance
We'll visualize the feature importance using a bar plot.
plt.figure(figsize=(10, 6))
sns.barplot(x=feature_importance, y=feature_names)
plt.title('Feature Importance')
plt.xlabel('Importance')
plt.ylabel('Features')
plt.show()
Output:
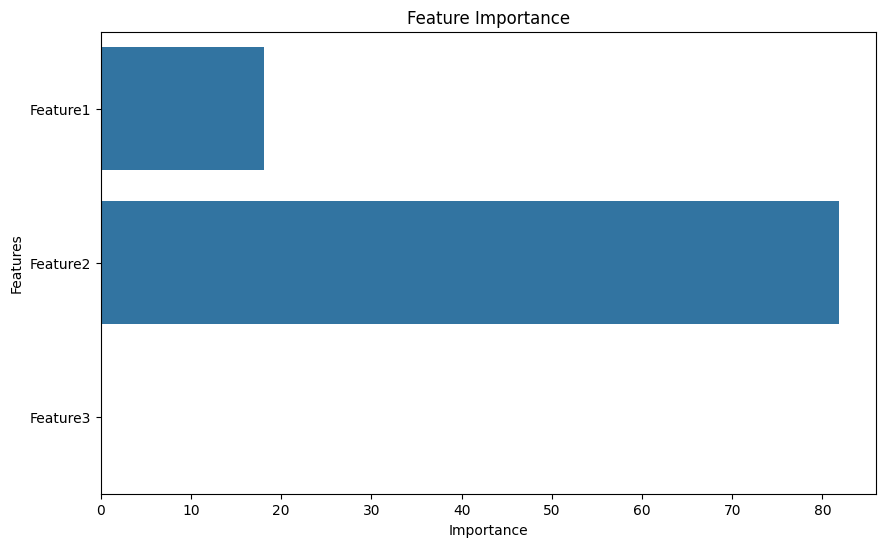
The output will display the importance of each feature and a bar plot visualizing this importance.
Example 2: Public Dataset
For the second example, we'll use the well-known Titanic dataset, which contains information about passengers on the Titanic.
Step 1: Import Necessary Libraries
We already imported the libraries in the first example, so we can reuse them here.
Step 2: Load the Public Dataset
We'll load the Titanic dataset directly from a URL.
url = 'https://web.stanford.edu/class/archive/cs/cs109/cs109.1166/stuff/titanic.csv'
data = pd.read_csv(url)
Step 3: Prepare the Data
We'll prepare the data by selecting relevant features and handling missing values.
# Select relevant features
features = ['Pclass', 'Sex', 'Age', 'Fare']
data = data[features + ['Survived']].dropna()

# Encode categorical data
data['Sex'] = data['Sex'].astype('category')

# Split data into features and target
X = data[features]
y = data['Survived']
Step 4: Train the CatBoost Model
We'll initialize and train the CatBoost model.
model = CatBoostRegressor(iterations=100, learning_rate=0.1, depth=3, verbose=False)
model.fit(X, y, cat_features=['Sex']) # Specify 'Sex' as a categorical feature
Output:
<catboost.core.CatBoostRegressor at 0x79ebac8661d0>Step 5: Calculate Feature Importance
We can now calculate the feature importance using the get_feature_importance method.
feature_importance = model.get_feature_importance()
feature_names = X.columns

# Display feature importance
for name, importance in zip(feature_names, feature_importance):
    print(f"Feature: {name}, Importance: {importance:.2f}")
Output:
Feature: Pclass, Importance: 20.91
Feature: Sex, Importance: 54.26
Feature: Age, Importance: 13.54
Feature: Fare, Importance: 11.29
Step 6: Visualize Feature Importance
We'll visualize the feature importance using a bar plot.
# Create a more creative plot using Seaborn
plt.figure(figsize=(10, 6))
sns.barplot(x=feature_importance, y=feature_names, palette='rocket')
plt.title('Feature Importance', fontweight='bold', fontsize=16)
plt.xlabel('Importance', fontweight='bold', fontsize=12)
plt.ylabel('Features', fontweight='bold', fontsize=12)

# Add data labels
for i, value in enumerate(feature_importance):
    plt.text(value + 0.3, i, f'{value:.2f}', fontweight='bold', fontsize=10)

# Improve aesthetics
sns.despine(left=True, bottom=True)
plt.tight_layout()

# Show the plot
plt.show()
Output:
.png)
