E-commerce platforms use product recommendations to enhance customer experience and increase sales. CatBoost is a gradient boosting algorithm designed to efficiently handle categorical data and missing values making it ideal for this task. It works by combining decision trees and correcting errors from previous trees to create a strong predictive model. In this article we’ll use CatBoost to build a product recommendation system predicting items a customer is likely to be interested in based on their browsing and purchase history.
Step 1: Import Libraries
We will import numpy, pandas, matplotlib, seaborn and scikit learn. We will also be using catboost library to implement it and ipywidgets for creating a widget to see recommendation.
import pandas as pd
import numpy as np
import matplotlib.pyplot as plt
import seaborn as sns
import ipywidgets as widgets
from IPython.display import display

from catboost import CatBoostClassifier, Pool
from sklearn.model_selection import train_test_split
from sklearn.metrics import accuracy_score, confusion_matrix
Step 2: Load the Dataset
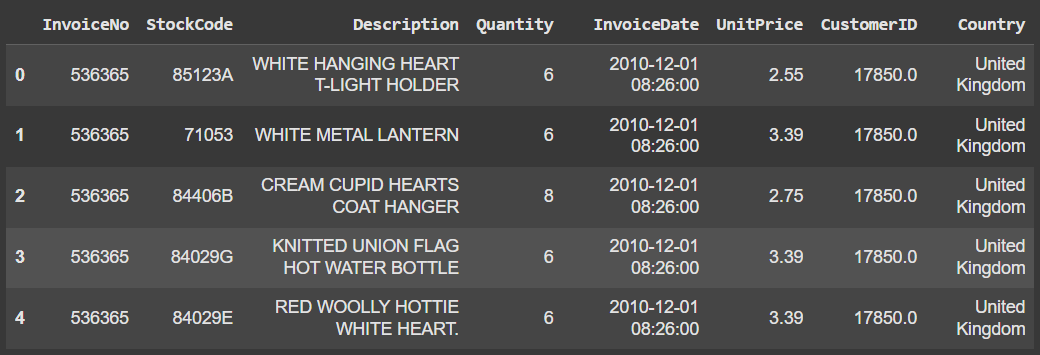
We'll use the Online Retail dataset for this implementation.
import pandas as pd

df = pd.read_excel('Online-Retail.xlsx')
df.head()
Output:
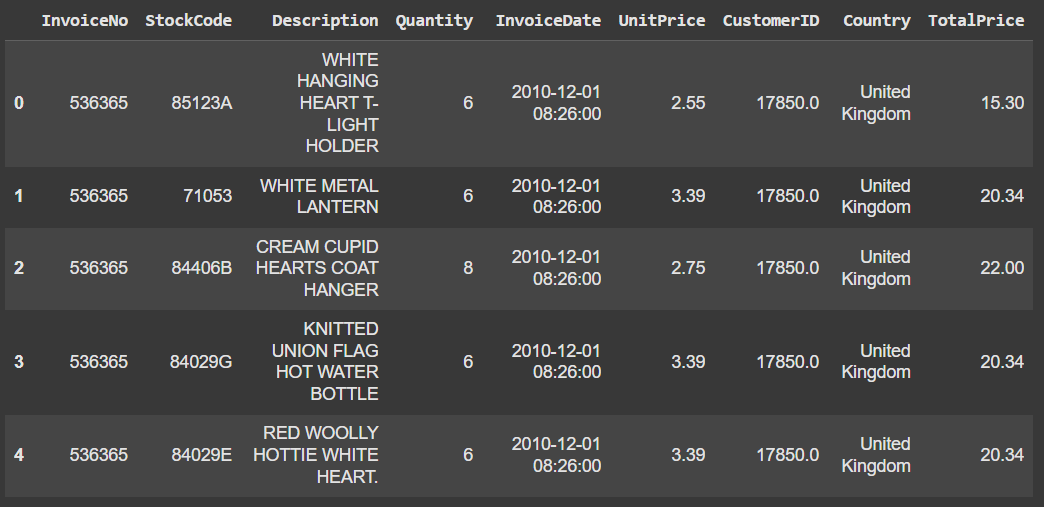
Step 3: Data Preprocessing
Before we can train a model we need to clean and preprocess the data. We will do:
- Drop rows with missing values
- Convert InvoiceDate to datetime
- Create a new column for total price
- Filter out negative quantities
df.dropna(inplace=True)

df['InvoiceDate'] = pd.to_datetime(df['InvoiceDate'])

df['TotalPrice'] = df['Quantity'] * df['UnitPrice']

df = df[df['Quantity'] > 0]

df.head()
Output:
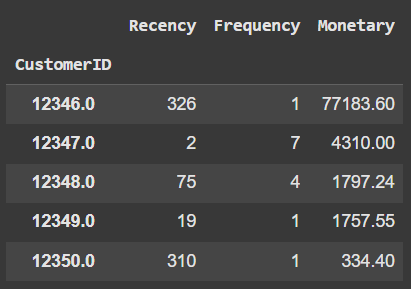
Step 4: Feature Engineering
Feature engineering is a technique where we engineer new features based on existing features. We'll create features like the recency, frequency and monetary value (RFM) for each customer.
- reference_date is set to one day after the latest invoice date
- Groups data by CustomerID to calculate RFM metrics
- Recency: Days since last purchase
- Frequency: Number of unique invoices
- Monetary: Total spending (TotalPrice)
- Renames columns to 'Recency', 'Frequency', 'Monetary'
- rfm.head() shows the first few rows of the RFM table
reference_date = df['InvoiceDate'].max() + pd.Timedelta(days=1)

rfm = df.groupby('CustomerID').agg({
    'InvoiceDate': lambda x: (reference_date - x.max()).days,
    'InvoiceNo': 'nunique',
    'TotalPrice': 'sum'
})

rfm.columns = ['Recency', 'Frequency', 'Monetary']

rfm.head()
Output:
Step 5: Train-Test Split
Split the data into training and testing sets. Here we split 80% dataset for training and 20% for testing.
- X uses 'Recency', 'Frequency', 'Monetary' as features
- y is 1 if 'Monetary' > median, else 0
- Data split: 80% train, 20% test
- random_state=42 for reproducibility
- shape shows rows and columns in each split
X = rfm[['Recency', 'Frequency', 'Monetary']]
y = np.where(rfm['Monetary'] > rfm['Monetary'].median(), 1, 0)

X_train, X_test, y_train, y_test = train_test_split(X, y, test_size=0.2, random_state=42)

X_train.shape, X_test.shape, y_train.shape, y_test.shape
Output:
((3471, 3), (868, 3), (3471,), (868,))
Step 6: Train the CatBoost Model
Now, we'll train a CatBoost classifier on the training data.
- iterations = 100: Defines the number of trees to be built (100 in this case) each improving the model.
- learning_rate = 0.1: Controls the contribution of each tree. A lower rate needs more trees to converge, balancing accuracy and training time.
- depth = 6: Specifies the depth of each tree. A depth of 6 offers a good trade-off between capturing complexity and avoiding overfitting.
- verbose = False: Suppresses training logs to keep the process quiet.
model = CatBoostClassifier(iterations=100, learning_rate=0.1, depth=6, verbose=False)

model.fit(X_train, y_train)

accuracy = model.score(X_test, y_test)
print(f'Accuracy: {accuracy:.2f}')
Output:
Accuracy: 1.00
Model is working fine but it may be overfitted we can further fine tune it to make model better.
Step 7: Visualize Feature Importance
CatBoost provides feature importance which helps understand which features are contributing the most to the predictions. We are doing this too understand why model is getting overfitted.
feature_importance = model.get_feature_importance()
features = X.columns

importance_df = pd.DataFrame({'Feature': features, 'Importance': feature_importance})

plt.figure(figsize=(10, 6))
sns.barplot(x='Importance', y='Feature', data=importance_df)
plt.title('Feature Importance')
plt.show()
Output:
.png)
We can see that only one feature i.e monetary is contributing maximum to prediction due to which model is getting overfitted. We can fine tune model to deal this issue.
Step 8: Interactive GUI with ipywidgets
We'll create an interactive GUI where users can input recency, frequency and monetary values to get a recommendation.
- Imports interactive widgets and display tools
- Creates sliders for Recency, Frequency, and Monetary inputs
- Defines output area to show prediction result
- make_prediction() creates a DataFrame and uses model to predict
- Returns "Recommend" if prediction is 1, else "Do not recommend"
- update_prediction() updates output when sliders change
- Observers trigger prediction on slider value changes
- Displays sliders and prediction output in notebook
import ipywidgets as widgets
from IPython.display import display

recency_input = widgets.IntSlider(min=0, max=365, step=1, description='Recency')
frequency_input = widgets.IntSlider(min=0, max=100, step=1, description='Frequency')
monetary_input = widgets.FloatSlider(min=0, max=10000, step=0.01, description='Monetary')

output = widgets.Output()

def make_prediction(recency, frequency, monetary):
    data = pd.DataFrame({'Recency': [recency], 'Frequency': [frequency], 'Monetary': [monetary]})
    prediction = model.predict(data)[0]
    return "Recommend" if prediction == 1 else "Do not recommend"

def update_prediction(change):
    with output:
        output.clear_output()
        prediction = make_prediction(recency_input.value, frequency_input.value, monetary_input.value)
        print(f'Recommendation: {prediction}')

recency_input.observe(update_prediction, names='value')
frequency_input.observe(update_prediction, names='value')
monetary_input.observe(update_prediction, names='value')

display(recency_input, frequency_input, monetary_input, output)
Output:

Our model is working fine helping E-commerce platform to decide which product to list down on their platform by providing powerful, efficient and accurate product recommendations. As businesses continue to embrace machine learning technologies tools like CatBoost will play a important role in delivering personalized shopping experiences.
