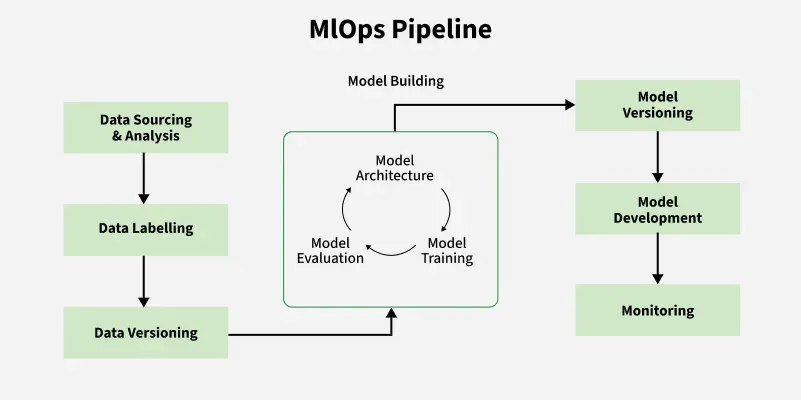
An MLOps pipeline is a step-by-step process used to manage and run machine learning (ML) projects more efficiently. MLOps helps connect the work of data scientists and software teams. It makes sure that machine learning models can be built, tested and used in real-world systems without problems. The pipeline usually includes these main stages:
- Data Collection and Preparation
- Model Training and Testing
- Model Deployment
- Model Monitoring
- Model Updates and Improvements
Each step is designed to run automatically and repeat whenever needed.
1. Data Collection and Preparation
In this step we collect raw data and make it ready for training a machine learning model.
- Data Collection: Gather data from files, databases, web APIs or devices.
- Cleaning: Fix or remove missing or incorrect data.
- Feature Engineering: Create new columns or modify existing ones to help the model learn better.
- Automation: Use tools like Airflow to run these tasks on a schedule.
2. Model Training and Testing
Here we train a machine learning model using the prepared data and then test how well it performs.
- Split Data: Divide the data into training and test parts.
- Train Model: Use models like Random Forest, Linear Regression, etc.
- Track Results: Save model settings and accuracy scores using MLflow.
3. Model Deployment
After training, the model is ready to be used in real applications. One way is to create a REST API using Flask then package it with Docker.
- Containerization : Use Docker to package the model and its dependencies into a portable container.
- Orchestration : Kubernetes can manage containerized deployments at scale.
- API Endpoints : Expose models as RESTful APIs using frameworks like FastAPI or Flask.
- CI/CD Integration : Integrate deployment workflows with CI/CD pipelines using Jenkins, GitHub Actions or GitLab CI.
4. Monitoring the Model
After deployment you need to keep an eye on how well the model is performing. This includes checking accuracy and detecting changes in the input data.
- Prometheus collects performance data.
- Grafana shows this data in graphs.
5. Feedback and Improvements
Machine learning models can improve over time. You can test new versions and collect feedback to update the models.
- A/B Testing: Run two versions of a model to compare results.
- User Feedback: Use suggestions or complaints to improve predictions.
Implementation of MLOps Pipeline
Implementing an MLOps pipeline means creating a system where machine learning models can be built, tested, deployed and monitored smoothly. Below is a step-by-step guide to build this pipeline using Python, Docker and Kubernetes.
Step 1: Data Ingestion and Preprocessing
Airflow is a tool for orchestrating data pipelines. Here's an example DAG (Directed Acyclic Graph) that automates data ingestion and preprocessing:
from airflow import DAG
from airflow.operators.python_operator import PythonOperator
from datetime import datetime
import pandas as pd


def preprocess_data():
    df = pd.read_csv('data/raw_data.csv')
    df.fillna(0, inplace=True)
    df['new_feature'] = df['feature_1'] * df['feature_2']
    df.to_csv('data/preprocessed_data.csv', index=False)


default_args = {
    'owner': 'airflow',
    'start_date': datetime(2023, 1, 1),
    'retries': 1,
}

dag = DAG(
    'data_preprocessing_pipeline',
    default_args=default_args,
    schedule_interval='@daily',
)

preprocess_task = PythonOperator(
    task_id='preprocess_data',
    python_callable=preprocess_data,
    dag=dag,
)

preprocess_task
Step 2: Model Training with MLflow for Experiment Tracking
MLflow helps track experiments, log parameters and store models. Below is an example of training a model using scikit-learn and logging it with MLflow:
import mlflow
from sklearn.model_selection import train_test_split
from sklearn.ensemble import RandomForestClassifier
from sklearn.metrics import accuracy_score
import pandas as pd

df = pd.read_csv('data/preprocessed_data.csv')
X = df.drop('target', axis=1)
y = df['target']
X_train, X_test, y_train, y_test = train_test_split(
    X, y, test_size=0.2, random_state=42)
with mlflow.start_run():

    model = RandomForestClassifier(n_estimators=100, random_state=42)
    model.fit(X_train, y_train)

    y_pred = model.predict(X_test)
    accuracy = accuracy_score(y_test, y_pred)

    mlflow.log_param("n_estimators", 100)
    mlflow.log_metric("accuracy", accuracy)

    mlflow.sklearn.log_model(model, "random_forest_model")
Step 3: Model Deployment
Once the model is trained it can be deployed as a REST API using Flask and containerized with Docker.
Flask API Code (app.py):
from flask import Flask, request, jsonify
import joblib
import pandas as pd

app = Flask(__name__)

model = joblib.load('model/random_forest_model.pkl')


@app.route('/predict', methods=['POST'])
def predict():
    data = request.json
    df = pd.DataFrame([data])
    prediction = model.predict(df)
    return jsonify({'prediction': int(prediction[0])})


if __name__ == '__main__':
    app.run(host='0.0.0.0', port=5000)
Dockerfile:
# Base image
FROM python:3.8-slim

# Set working directory
WORKDIR /app

# Install dependencies
COPY requirements.txt requirements.txt
RUN pip install -r requirements.txt

# Copy application code
COPY . .

# Expose port
EXPOSE 5000

# Run the app
CMD ["python", "app.py"]
Build and run the Docker container:
docker build -t ml-model-api .
docker run -p 5000:5000 ml-model-api
Step 4: Monitoring Model Performance with Prometheus and Grafana
Prometheus collects metrics and Grafana visualizes them. Below is an example of setting up monitoring for model accuracy.
Prometheus Configuration (prometheus.yml):
global:
  scrape_interval: 15s

scrape_configs:
  - job_name: 'ml_model'
    static_configs:
      - targets: ['localhost:8000']
Export Metrics with Flask:
from flask import Flask
from prometheus_client import start_http_server, Counter

app = Flask(__name__)
REQUESTS = Counter('http_requests_total', 'Total HTTP Requests')


@app.route('/')
def home():
    REQUESTS.inc()
    return "Hello, World!"


if __name__ == '__main__':
    start_http_server(8000)
    app.run(port=5000)
Run Prometheus and Grafana locally using Docker Compose:
version: '3'
services:
  prometheus:
    image: prom/prometheus
    volumes:
      - ./prometheus.yml:/etc/prometheus/prometheus.yml
    ports:
      - "9090:9090"
  grafana:
    image: grafana/grafana
    ports:
      - "3000:3000"
Start the services:
docker-compose up
Step 5: Feedback and Iteration
A/B testing compares two versions of a model. Below is an example of serving two models simultaneously using FastAPI.
from fastapi import FastAPI, Query
import joblib
import pandas as pd

app = FastAPI()

model_a = joblib.load('model/model_a.pkl')
model_b = joblib.load('model/model_b.pkl')


@app.post("/predict/")
async def predict(features: dict, model_version: str = Query(..., enum=["A", "B"])):
    df = pd.DataFrame([features])
    if model_version == "A":
        prediction = model_a.predict(df)
    elif model_version == "B":
        prediction = model_b.predict(df)
    return {"model_version": model_version, "prediction": int(prediction[0])}
Run the API:
uvicorn app:app --reload
Here’s a high-level overview of how these components fit into an MLOps pipeline:
- Data Pipeline : Use Airflow to automate data ingestion and preprocessing.
- Model Training : Use MLflow to track experiments and log models.
- Model Deployment : Containerize the model with Docker and deploy it as a REST API.
- Monitoring : Use Prometheus and Grafana to monitor model performance in production.
- Iteration : Implement A/B testing and feedback loops to refine the model.
By combining these tools and techniques, you can build a robust MLOps pipeline that ensures your machine learning models are efficient, scalable and reliable.
Essential Tools and Technologies for MLOps
| Category | Tool/Technology | Purpose |
|---|---|---|
| Data Management | Apache Kafka | Real-time data streaming |
| Apache Airflow | Workflow orchestration | |
| Model Development | Jupyter Notebooks | Interactive model development |
| TensorFlow | Building and training models | |
| Model Deployment | Docker | Containerizing models |
| Kubernetes | Orchestrating containerized applications | |
| Monitoring and Maintenance | Prometheus | Monitoring metrics |
| Grafana | Visualizing performance data | |
| CI/CD | Jenkins | Automating integration and deployment |
| GitLab CI | Managing CI/CD pipelines |
Best Practices for Effective MLOps
- Monitor Load: Track response time, throughput and errors to ensure models scale under heavy traffic (e.g., peak e-commerce demand).
- Detect Drift: Watch for data changes that reduce accuracy and retrain models regularly to stay reliable.
- Ensure Security: Protect sensitive data with encryption, access control and audits for compliance.
