Coefficient of Skewness is a statistical measure that indicates the asymmetry of data around its mean, revealing whether the data is skewed to the left, right, or is symmetrical.
By identifying the direction and degree of skewness, researchers can gain insights into the underlying patterns and characteristics of the data.
Skewness
Skewness is a statistical measure that describes the asymmetry of a data distribution. It indicates whether the data points are more spread out on one side of the distribution's mean than the other. Skewness can be positive, negative, or zero, each providing insights into the shape of the distribution.
Types of Skewness
Skewness can be classified into two main types:
- Positive Skewness
- Negative Skewness
Positive Skewness (Right Skew)
A distribution is said to be positively skewed when the tail on the right side of the distribution is longer or fatter than the tail on the left side.
In a positively skewed distribution, the mean is greater than the median, which is greater than the mode. This means that the distribution has a longer tail towards the right side, with a few extreme values pulling the mean towards the right.
Example: Income distribution in many countries is often positively skewed, with a small number of individuals having very high incomes, while the majority have lower to moderate incomes.
Negative Skewness (Left Skew)
A distribution is said to be negatively skewed when the tail on the left side of the distribution is longer or fatter than the tail on the right side.
In a negatively skewed distribution, the mean is less than the median, which is less than the mode. This means that the distribution has a longer tail towards the left side, with a few extreme values pulling the mean towards the left.
Example: The distribution of test scores in a class where most students perform well but a few students perform poorly can result in a negatively skewed distribution.
Coefficient of Skewness
The coefficient of skewness is a numerical value that quantifies the degree of skewness in a probability distribution. It provides a standardized measure of the asymmetry or lack of symmetry in the distribution, allowing for comparison across different datasets or distributions.
The coefficient of skewness can take values ranging from negative infinity to positive infinity. A value of zero indicates a perfectly symmetrical distribution, while positive values indicate positive skewness (skewed to the right), and negative values indicate negative skewness (skewed to the left).
Types of Coefficient of Skewness
There are several measures or coefficients used to quantify skewness in a distribution. The most commonly used coefficients of skewness are:
- Pearson's Coefficient
- Pearson's First Coefficient
- Pearson's Second Coefficient
- Bowley's Coefficient
- Kelly's Coefficient
There are also other less common coefficients, such as the Grubbs' Coefficient, Isogradient Coefficient, and Momal Coefficient, which are used in specific situations or for particular types of data distributions.
Pearson's First Coefficient of Skewness
Pearson's First Coefficient of Skewness is a measure of skewness that compares the mean and the mode of a data distribution. Pearson's First Coefficient of Skewness, also known as the moment coefficient of skewness, is one of the most widely used measures of skewness. It is used to determine the direction and extent of the skewness in the data.
Pearson's First Coefficient Formula
Pearson's First Coefficient of Skewness is calculated using the following formula:
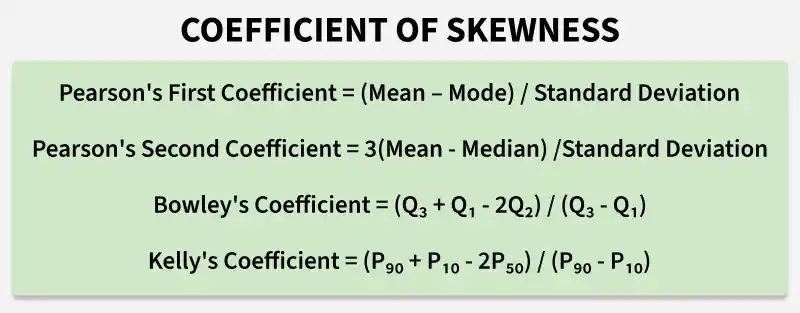
Pearson's First Coefficient Formula = (Mean - Mode)/Standarad Deviation
Where,
- Mean is the average value of the dataset.
- Mode is the most frequently occurring value in the dataset.
- Standard Deviation is a measure of the amount of variation or dispersion in the dataset.
Pearson's Second Coefficient of Skewness
Pearson's Second Coefficient of Skewness is an alternative measure of skewness that is less influenced by outliers or extreme values in the distribution compared to Pearson's First Coefficient of Skewness.
Pearson's Second Coefficient Formula
Pearson's Second Coefficient of Skewness is calculated using the following formula:
Pearson's Second Coefficient = 3(Mean − Median)/Standard Deviation
Where,
- Mean is the average value of the dataset.
- Median is the central value in the dataset.
- Standard Deviation is a measure of the amount of variation or dispersion in the dataset.
Bowley's Coefficient of Skewness
Bowley's Coefficient of Skewness is a statistical measure that helps determine the skewness or asymmetry of a data distribution. It is particularly useful for identifying the direction and degree of skewness in a dataset. Unlike other measures of skewness that rely on mean and standard deviation, Bowley's method uses quartiles, making it robust against outliers.
Bowley's Coefficient Formula
Bowley's Coefficient of Skewness is calculated using the following formula:
Bowley's Coefficient = (Q3 - Q2) - (Q2 - Q1)/(Q3 - Q1)
OR
Bowley's Coefficient = (Q3 + Q1 - 2Q2) /(Q3 - Q1)
Where,
- Q1 is the first quartile (25th percentile)
- Q2 is the second quartile (median or 50th percentile)
- Q3 is the third quartile (75th percentile)
Kelly's Coefficient of Skewness
Kelly's Coefficient of Skewness is a statistical measure that helps in determining the skewness of a data distribution. It is particularly useful because it relies on percentiles, making it a robust measure against outliers and extreme values.
Kelly's Coefficient Formula
Kelly's Coefficient = (P90 + P10 - 2P50) / (P90 - P10)
Where,
- P10 = 10th percentile
- P50 = Median (50th percentile)
- P90 = 90th percentile
Interpreatation of Coefficient of Skewness
We can interpret the coefficient using it's sign and refer to the following table:
| Coefficient of Skewness | Description | Interpretation |
|---|---|---|
| Positive | The coefficient is positive. | The data distribution is skewed to the right, indicating a longer tail on the right side. |
| Negative | The coefficient is negative. | The data distribution is skewed to the left, indicating a longer tail on the left side. |
| Zero | The coefficient is zero. | The data distribution is symmetric. |
Read More:
