Prerequisites: Matplotlib, Scipy
In this article, we will see how to find all 'x' point above 0 with the help of find_peaks( ) function, that takes a 1-D array and finds all local maxima by a simple comparison of neighboring values.
Approach:
- Import required module.
- Find peaks inside a signal based on find_peaks() properties.
- Label the graph.
- Display Graph.
Step 1: Import all libraries.
import matplotlib.pyplot as plt
import numpy as np
from scipy.signal import find_peaks
from scipy import signal
Step 2: electrocardiogram(): The returned signal is a 5-minute-long electrocardiogram (ECG), a medical recording of the heart’s electrical activity, sampled at 360 Hz.
Syntax:
scipy.signal.find_peaks(x, height=None)
Parameter:
- x: A signal with peaks.
- height: Required height of peaks. Either a number, None,
Return:
peaks: Indices of peaks in x that satisfy all given conditions.
peak_heights: If the height is given, the height of each peak is x.
import matplotlib.pyplot as plt
import numpy as np
from scipy.signal import find_peaks
from scipy import signal

t = np.linspace(0, 1, 500, endpoint=False)
sig = np.sin(2 * np.pi * t)
x= signal.square(2 * np.pi * 30 * t, duty=(sig + 1)/2)
peak, _ = find_peaks(x, height=0)
Below is the full Implementation:
import matplotlib.pyplot as plt
import numpy as np
from scipy.signal import find_peaks
from scipy import signal
t = np.linspace(0, 1, 500, endpoint=False)
sig = np.sin(2 * np.pi * t)
x= signal.square(2 * np.pi * 30 * t, duty=(sig + 1)/2)
peak, _ = find_peaks(x, height=0)
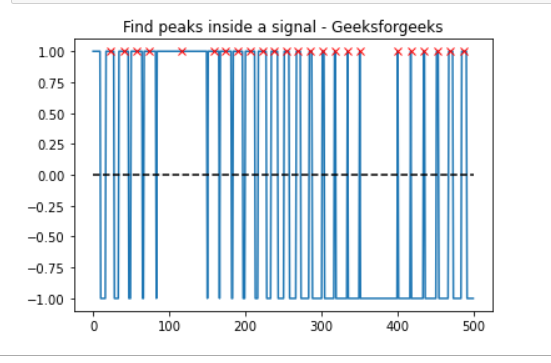
plt.plot(x)
plt.title("Find peaks inside a signal - Geeksforgeeks")
plt.plot(peak, x[peak], "x", color = 'r')
plt.plot(np.zeros_like(x), "--", color="black")
plt.show()
Output: