It is a financial data library for developers that provides a simple and convenient way to access historical market data from Yahoo Finance. It allows users to download stock price data, financial statements, and other relevant financial information for analysis and trading. With its easy-to-use interface and comprehensive data access, yFinance is a valuable library for financial analysis and research in Python. In this article, we will learn how to Check yfinance version in Python.
Check yfinance version in Python
Step 1: Check Python Installation
Verify Python is installed on your system. This command outputs the Python version.
python --version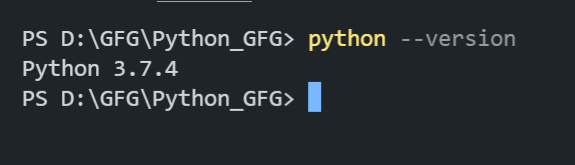
Step 2: Check PIP Installation
Confirm PIP is installed. This command shows the pip version if it’s available.
pip --version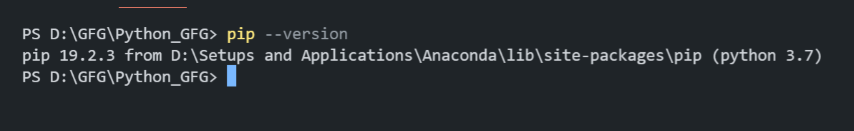
Step 3: Install yfinance
Use pip to install the yfinance library. This command fetches and installs yfinance and its dependencies.
pip install yfinance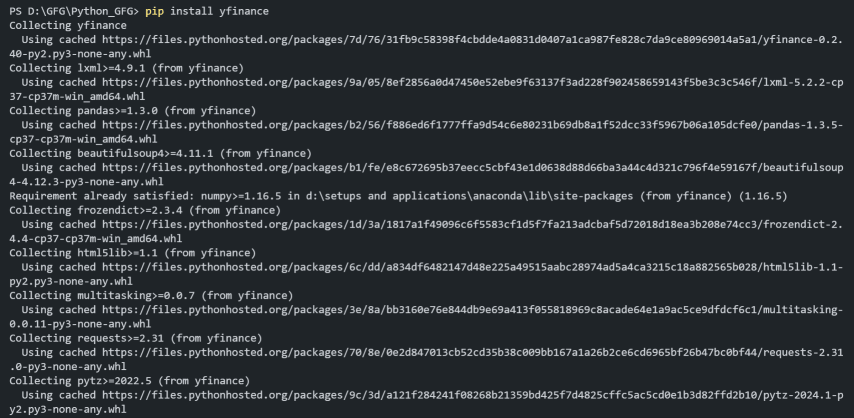
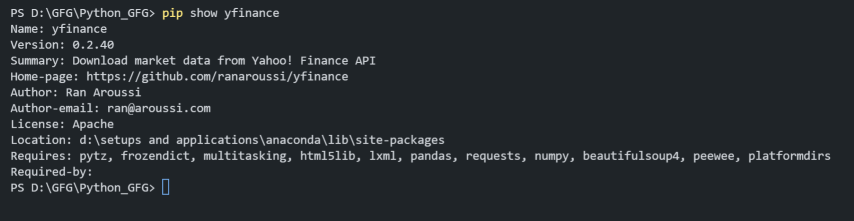
Step 4: Check yfinance version
Check Package Installation detailed by executing the below command in the terminal.
pip show yfinanceThis command provides detailed information about the yfinance package, including its version, location, and dependencies.
Importing yfinance
Below is the process to import yfinance in Python.
Import yfinance
Once the installation is complete, you can import the yfinance library in your Python script or Jupyter Notebook by using the following import statement:
import yfinanceExample: Displaying MSFT Data in Bar Chart
In this example, we are using yfinance to fetch the historical trading data for Microsoft (MSFT) over the last six months. A bar chart is then created using matplotlib to visualize the volume of shares traded each day, with the volume data plotted on the y-axis and the dates on the x-axis. The chart is customized with labels, a legend, and a grid for better readability.
import yfinance as yf
import matplotlib.pyplot as plt
ticker = "MSFT"
microsoft = yf.Ticker(ticker)
hist = microsoft.history(period="6mo")
plt.figure(figsize=(10, 6))
plt.bar(hist.index, hist['Volume'], label='Volume', color='blue')
plt.title(f'{ticker} Volume Traded Over the Last 6 Months')
plt.xlabel('Date')
plt.ylabel('Volume')
plt.legend()
plt.grid(True)
plt.show()
Output:

Conclusion
In conclusion, importing and using the yfinance library in Python allows developers to efficiently access and analyze historical financial data from Yahoo Finance. By following the steps to set up pip, install yfinance, and import it into your project, you can use ts capabilities to perform comprehensive financial analysis and visualization.
