In statistics, kurtosis measures the tailedness of a probability distribution. It helps us understand whether the data have heavy tails, light tails or are normally distributed. Based on kurtosis, distributions can be classified into three types:
- Leptokurtic (Kurtosis > 3)
- Mesokurtic (Kurtosis ≈ 3, like the Normal Distribution)
- Platykurtic (Kurtosis < 3)
Among these, leptokurtic distributions are of particular interest in various fields like finance, risk management and quality control due to their potential to capture extreme values.
What is a Leptokurtic Distribution?
A leptokurtic distribution is characterized by:
- High kurtosis: The kurtosis value exceeds 3.
- Heavy tails: The distribution has fatter tails compared to a normal distribution.
- Sharper peak: A leptokurtic distribution exhibits a more pronounced peak near the mean.
In simpler terms, leptokurtic distributions indicate that data are prone to producing extreme outliers or rare events more frequently than a normal distribution.
Mathematical Definition of Kurtosis
Kurtosis is mathematically expressed as:
\text{Kurtosis} = \frac{\mu_4}{\sigma^4} = \frac{\left( \frac{1}{n} \sum_{i=1}^{n} (x_i - \mu)^2 \right)^2}{\frac{1}{n} \sum_{i=1}^{n} (x_i - \mu)^4}
Where:
- μ4 = Fourth central moment
- σ = Standard deviation
- μ = Mean of the distribution
A leptokurtic distribution occurs when: Kurtosis > 3
Characteristics of Leptokurtic Distributions
- Extreme Tails: Higher probability of extreme values compared to the normal distribution.
- High Peak: Sharp peak around the mean, indicating that most values cluster tightly around the central value.
- Outlier Sensitivity: Increased sensitivity to outliers, making them more common.
Example - Student's t-distribution with small degrees of freedom, it shows heavier tails.
Python Code to Calculate Kurtosis
In this Implementation, we calculate the kurtosis of a dataset to assess its distribution type
import numpy as np
import matplotlib.pyplot as plt
from scipy.stats import kurtosis, norm
data = [12, 15, 14, 17, 19, 21, 35, 45, 50, 60]
# Calculating kurtosis
kurt = kurtosis(data)
print(f"Kurtosis: {kurt:.4f}")
# Checking if the distribution is leptokurtic
if kurt > 3:
print("leptokurtic (high kurtosis).")
elif kurt == 3:
print("mesokurtic (normal kurtosis).")
else:
print("platykurtic (low kurtosis).")
# Visualization
plt.figure(figsize=(8, 6))
plt.hist(data, bins=10, density=True, alpha=0.6, color='g', edgecolor='black')
xmin, xmax = plt.xlim()
x = np.linspace(xmin, xmax, 100)
p = norm.pdf(x, np.mean(data), np.std(data))
plt.plot(x, p, 'k', linewidth=2)
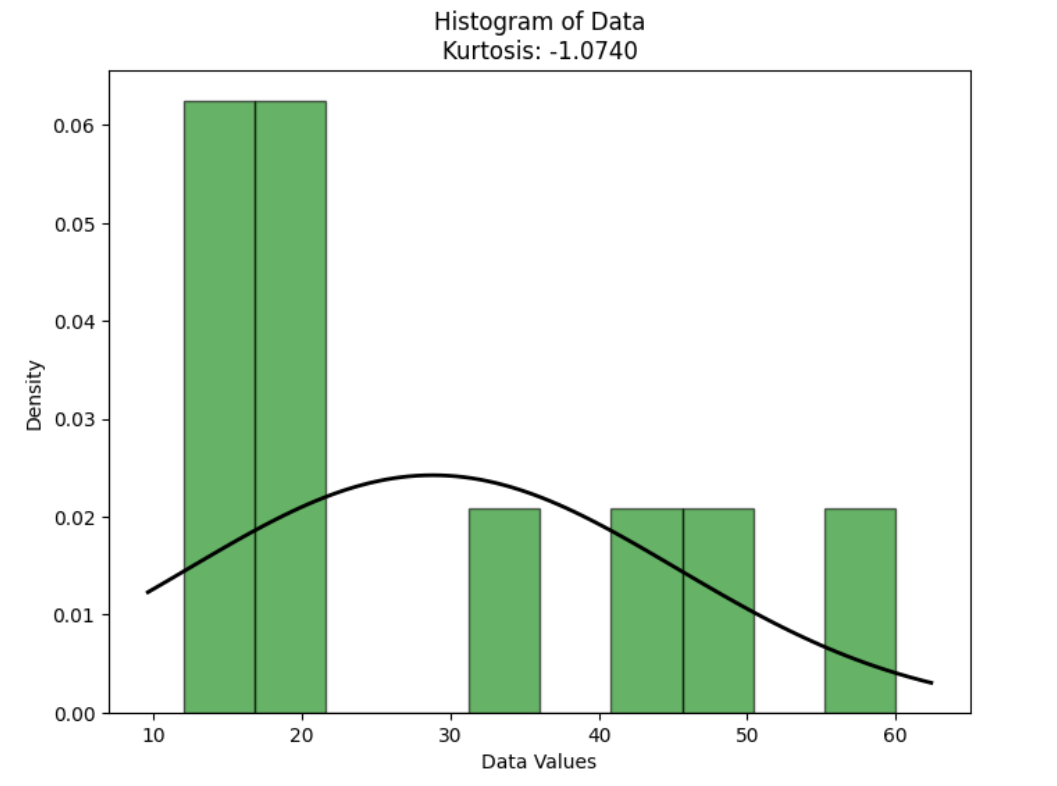
plt.title(f"Histogram of Data\nKurtosis: {kurt:.4f}")
plt.xlabel('Data Values')
plt.ylabel('Density')
plt.show()
Output
Kurtosis: -1.0740
The distribution is platykurtic (low kurtosis).
Result:
- The calculated kurtosis is -1.0740, indicating a platykurtic distribution with light tails and a flatter peak than the normal distribution.
- The histogram and normal curve show a flatter distribution, confirming the platykurtic nature of the data.
Visual Representation
- A leptokurtic distribution has a sharper peak and thicker tails compared to the bell-shaped normal distribution.
- Normal Distribution (Mesokurtic): Symmetrical with moderate tails.
- Leptokurtic Distribution: High peak and fat tails, indicating high kurtosis.
Risks Associated with Leptokurtic Distributions
- Increased Uncertainty: Extreme values can distort standard statistical models.
- Misleading Inference: Traditional statistical techniques assuming normality may fail.
- Underestimation of Risk: Risk models may underestimate potential losses due to extreme events.
Leptokurtic vs. Mesokurtic vs. Platykurtic Distributions
Property | Leptokurtic | Mesokurtic | Platykurtic |
|---|---|---|---|
Kurtosis | > 3 | = 3 | < 3 |
Tails | Fat | Moderate | Thin |
Peak | Sharp | Normal | Flat |
Outliers | More Frequent | Moderate | Less Frequent |
How to Detect Leptokurtic Distributions
- Kurtosis Test: Use statistical tests like the Jarque-Bera test to detect high kurtosis.
- Graphical Methods: Histograms and QQ-plots can visually highlight heavy tails.
- Skewness-Kurtosis Analysis: Analyze skewness and kurtosis together to assess asymmetry and tailedness.
Applications of Leptokurtic Distributions
- Finance and Risk Management: Modeling asset returns to predict the likelihood of rare events.
- Quality Control and Manufacturing: Identifying processes with high variability and extreme outliers.
- Environmental Studies: Studying rare environmental events such as earthquakes and hurricanes.
