dunif() function in R Language is used to provide the density of the distribution function.
Syntax: dunif(x, min = 0, max = 1, log = FALSE) Parameters: x: represents vector min, max: represents lower and upper limits of the distribution log: represents logical value for probabilitiesExample 1:
# Create vector of random deviation
u <- runif(20)

dunif(u) == u

print(dunif(u))
[1] FALSE FALSE FALSE FALSE FALSE FALSE FALSE FALSE FALSE FALSE FALSE FALSE
[13] FALSE FALSE FALSE FALSE FALSE FALSE FALSE FALSE
[1] 1 1 1 1 1 1 1 1 1 1 1 1 1 1 1 1 1 1 1 1
Example 2:
# Output to be present as PNG file
png(file = "dunifGFG.png")
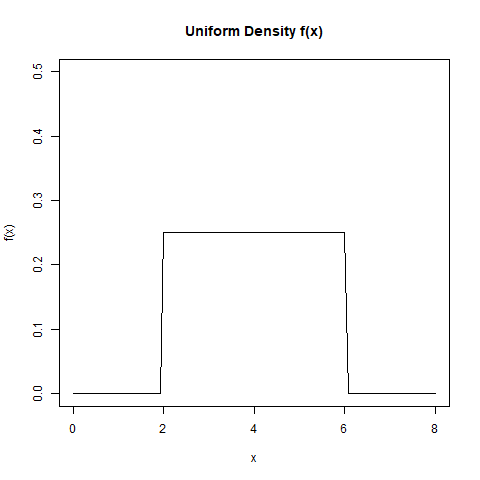
# Plot density
curve(dunif(x, min = 2, max = 6), 0, 8, ylim = c(0, 0.5),
ylab = "f(x)", main = "Uniform Density f(x)")
# Saving the file
dev.off()