When working with large numerical data in R using ggplot2, axis values can sometimes become cumbersome and hard to read, especially when the numbers are in the millions or billions. Displaying these values in a more readable format, such as in millions (e.g., 1,000,000 as 1M), enhances the clarity and presentation of your plot. This article will guide you through the steps of formatting your axis values to display in millions using ggplot2 in R Programming Language.
Why Format Axis Values in Millions?
Playing large numbers in full form can make your plots difficult to interpret. For example:
1,000,000can be more intuitively represented as1M.- Reduces clutter and ensures better readability.
- Provides a more professional and polished appearance.
Setting Up the Environment
Before starting, make sure you have the necessary packages installed and loaded.
# Install ggplot2 if you haven't already
install.packages("ggplot2")

# Load ggplot2
library(ggplot2)
Let's create a simple bar plot with values in millions to explain the problem.
# Create a sample data frame
data <- data.frame(
  category = c("A", "B", "C", "D"),
  value = c(1500000, 2500000, 5000000, 3000000)
)

# Create a basic bar plot using ggplot2
ggplot(data, aes(x = category, y = value)) +
  geom_bar(stat = "identity", fill = "skyblue") +
  theme_minimal() +
  labs(title = "Basic Plot with Large Numbers",
       x = "Category",
       y = "Value")
Output:
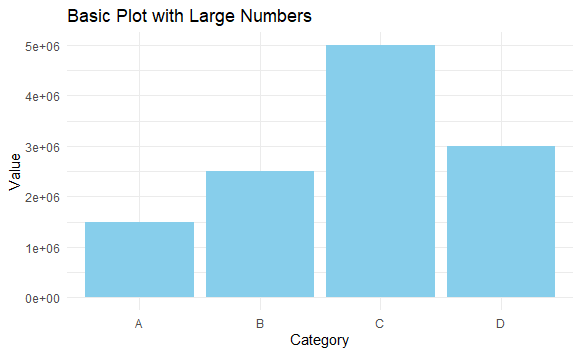
In this plot, the y-axis values are displayed as 1,500,000, 2,500,000, etc., which can be hard to read.
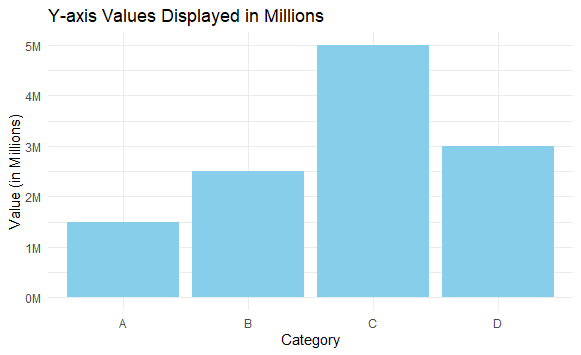
Method 1: Using scales Package to Format Axis Values
The scales package provides various tools to format axis labels easily. We'll use label_number() and label_comma() functions from scales to display values in millions.
# Install the scales package if you haven't already
install.packages("scales")

# Load the scales package
library(scales)

# Plot with y-axis labels formatted in millions
ggplot(data, aes(x = category, y = value)) +
  geom_bar(stat = "identity", fill = "skyblue") +
  scale_y_continuous(labels = label_number(scale = 1e-6, suffix = "M")) +
  theme_minimal() +
  labs(title = "Y-axis Values Displayed in Millions",
       x = "Category",
       y = "Value (in Millions)")
Output:
Method 2: Custom Axis Label Function Using scales::comma
You can also create a custom function to convert the axis values into millions by dividing them by 1e6.
# Custom function to format values in millions
format_millions <- function(x) {
  paste0(x / 1e6, "M")
}

# Plot using the custom function
ggplot(data, aes(x = category, y = value)) +
  geom_bar(stat = "identity", fill = "skyblue") +
  scale_y_continuous(labels = format_millions) +
  theme_minimal() +
  labs(title = "Y-axis Values Displayed in Millions (Custom Function)",
       x = "Category",
       y = "Value (in Millions)")
Output:
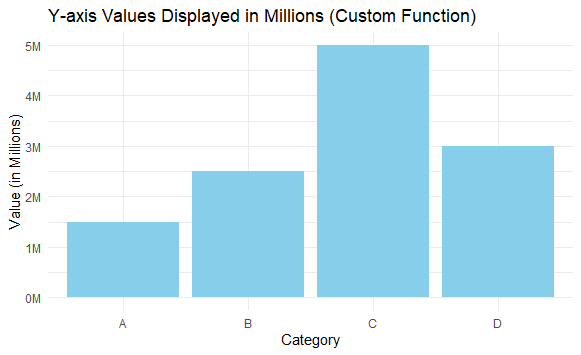
In this example, format_millions divides each axis value by 1e6 and appends "M" to the result.
Method 3: Formatting Axis Values Manually Using paste()
You can use paste() in combination with scales functions to manually control the axis labels.
# Plot with manually formatted axis labels
ggplot(data, aes(x = category, y = value)) +
  geom_bar(stat = "identity", fill = "skyblue") +
  scale_y_continuous(labels = function(x) paste0(x / 1e6, "M")) +
  theme_minimal() +
  labs(title = "Manually Formatted Axis Values",
       x = "Category",
       y = "Value (in Millions)")
Output:
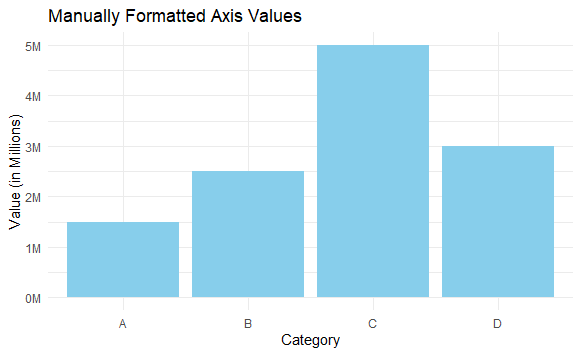
This approach gives you more control over how the labels are displayed but requires more manual handling.
Conclusion
In this article, we explored different ways to format axis values in ggplot2 to display them in millions. Using scales::label_number(), scales::label_comma(), custom functions, or manual formatting provides flexible and effective methods to enhance your visualizations. By formatting the axis values, you make your plots easier to read and more aesthetically pleasing, which is crucial when presenting data involving large numbers.
