Multivariate Analysis of Variance (MANOVA) is a statistical technique used to test whether multiple dependent variables differ across groups of a categorical independent variable simultaneously. It extends ANOVA by analyzing the combined effect of two or more related dependent variables, which is especially useful when these variables are correlated. In R, MANOVA helps determine whether the joint means of multiple continuous variables vary significantly between groups.
- Multiple Dependent Variables: Unlike ANOVA, which analyzes a single outcome variable, MANOVA evaluates multiple dependent variables simultaneously especially when they are correlated.
- Mean Vector Comparison: Instead of comparing individual means, MANOVA compares the vectors of group means across multiple dependent variables.
- Multivariate Test Statistics: MANOVA determines significance using statistics such as Wilks’ Lambda, Pillai’s Trace, Hotelling-Lawley Trace and Roy’s Largest Root.

Here three groups taking different medications (shown by the pills). We measure their weight and cholesterol levels to see if the groups differ. MANOVA tests if there are significant differences across these health measures together, helping us understand the overall effect of the treatments.
When to Use MANOVA
MANOVA is used to analyze the effect of one or more independent variables on multiple dependent variables simultaneously.
- Two or more continuous dependent variables that may be correlated are analyzed together.
- The independent variable is categorical and contains two or more groups.
- The researcher wants to examine the combined effect of independent variables on multiple dependent variables instead of performing separate ANOVA tests.
- The dataset satisfies key assumptions such as multivariate normality, homogeneity of variance–covariance matrices, and independence of observations.
Assumptions of MANOVA
Before applying the MANOVA test, certain statistical assumptions should be satisfied to ensure that the results are valid and reliable. These assumptions are similar to ANOVA but also include additional requirements because multiple dependent variables are analyzed simultaneously.
- Multivariate Normality: The dependent variables should follow a multivariate normal distribution within each group of the independent variable. In R, tests such as the Shapiro-Wilk test or Mardia’s test can be used to check normality.
- Homogeneity of Variance-Covariance Matrices: The variance covariance matrices of the dependent variables should be equal across groups. This is a multivariate extension of the homogeneity of variance assumption in ANOVA and can be tested using Box’s M test.
- Independence of Observations: The observations should be independent of each other, meaning the measurement of one observation should not influence another.
- Linearity: The dependent variables should have a linear relationship with each other within each group of the independent variable. Scatterplots are often used to check this assumption.
- Absence of Multicollinearity and Outliers: The dependent variables should not be highly correlated, and the dataset should not contain multivariate outliers, which can be checked using Mahalanobis distance.
Step By Step Implementation
Here we implement the MANOVA test in R on a sample dataset to analyze whether a categorical group variable significantly affects multiple dependent variables simultaneously.

Where:
- formula: Specifies the model in the form cbind(response1, response2, ...) ~ predictor, where multiple dependent variables are combined using cbind().
- data: A data frame that contains the variables used in the formula.
- projections: A logical value that indicates whether projection matrices should be returned.
- qr: A logical value that specifies whether the QR decomposition should be returned.
- contrasts: A list of contrast matrices used for factors in the model.
- ...: Additional arguments passed to the lm() function, such as subset or na.action.
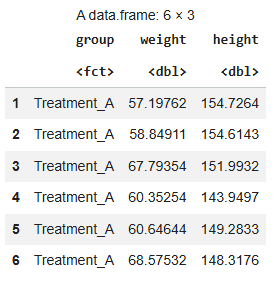
Step 1: Create Group Variable and Generate Synthetic Data
Create a categorical variable representing three treatment groups and generate synthetic data for the dependent variables weight and height using a normal distribution.
group <- factor(rep(c("Treatment_A", "Treatment_B", "Treatment_C"), each = 50))

weight <- rnorm(150, mean = c(60, 65, 70)[group], sd = 5)
height <- rnorm(150, mean = c(150, 155, 160)[group], sd = 6)
Step 2: Combine Variables into a Data Frame
Next, we combine the group variable and the generated dependent variables into a single dataset for analysis.
data <- data.frame(group, weight, height)
head(data)
Output:
Step 3: Fit the MANOVA Model
Here, we build the MANOVA model using the manova() function by combining the dependent variables using cbind().
manova_model <- manova(cbind(weight, height) ~ group, data = data)
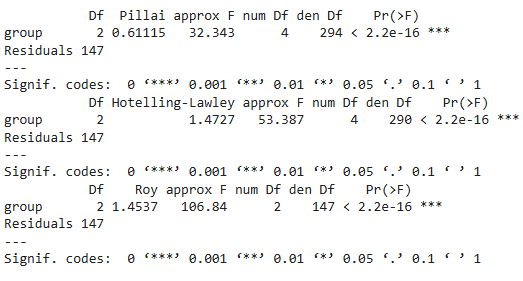
Step 4: View MANOVA Results Using Wilks’ Lambda
Now, we evaluate the MANOVA results using Wilks’ Lambda, which tests whether the mean vectors of the dependent variables differ across groups.
summary(manova_model, test = "Wilks")
Output:

Wilks’ Lambda = 0.39993 with p-value < 0.05, indicating that the treatment groups have a statistically significant multivariate effect on the dependent variables.
Step 5: View Results Using Other Multivariate Test Statistics
MANOVA also provides other multivariate statistics such as Pillai’s Trace, Hotelling–Lawley Trace, and Roy’s Largest Root to assess group differences.
summary(manova_model, test = "Pillai")
summary(manova_model, test = "Hotelling-Lawley")
summary(manova_model, test = "Roy")
Output:
Step 6: Perform Follow-up ANOVA Tests
After performing MANOVA, we run individual ANOVA tests for each dependent variable to identify which variables significantly differ across groups.
summary.aov(manova_model)
Output:
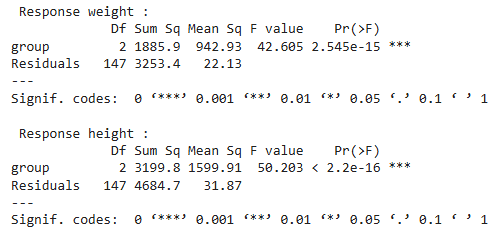
The output shows separate ANOVA results for each dependent variable after MANOVA. The very small p-values (< 0.05) indicate that the group variable significantly affects both weight and height individually.
Step 7: Visualize Group Differences Using Boxplots
We create boxplots to visualize how the dependent variables weight and height vary across different treatment groups. This helps in understanding the distribution and variation of each variable among groups.
par(mfrow=c(1,2))

boxplot(weight ~ group,
        data=data,
        col="lightblue",
        main="Weight Across Groups",
        xlab="Group",
        ylab="Weight")

boxplot(height ~ group,
        data=data,
        col="lightgreen",
        main="Height Across Groups",
        xlab="Group",
        ylab="Height")
Output:
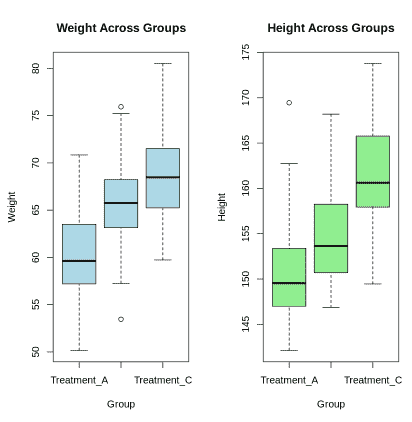
The boxplots show how the dependent variables vary across different groups. They help visualize group differences in each variable, supporting the multivariate test that evaluates the combined effect of these variables.
MANOVA vs. ANOVA
Here we compare MANOVA with ANOVA.
Feature | ANOVA | MANOVA |
|---|---|---|
Dependent Variables | One dependent variable | Two or more dependent variables |
Goal | Tests if group means differ for one variable | Tests if group means differ across multiple variables together |
Data Relationship | Does not consider correlation between dependent variables | Considers correlation among dependent variables |
Output | F-statistic for one dependent variable | Multivariate statistics |
Example | Comparing exam scores across different teaching methods | Comparing exam score and study time across different teaching methods |
Applications
- Feature Selection: MANOVA helps in identifying the most significant features for classification models.
- Medical Research: Used to analyze the effects of treatments on multiple health-related outcomes.
- Marketing Analysis: Helps in studying customer preferences across multiple product attributes.
- Behavioral Science: Used to analyze responses on psychological tests across different demographic groups.
