When visualizing data in R using ggplot2, you often need to adjust the appearance of your plots to make them clearer and more visually appealing. Two common adjustments include rotating x-axis labels for better readability and changing the overall theme of the plot to suit your presentation style or publication standards. This article will guide you through the process of rotating x-axis labels and evolving themes in ggplot2 using R Programming Language.
Understanding ggplot2 Themes
Themes in ggplot2 are an essential part of customizing the look of your plots. A theme controls the overall appearance, including background color, grid lines, font styles, and more. ggplot2 comes with several built-in themes, such as:
- theme_gray(): The default theme with a gray background.
- theme_bw(): A theme with a white background and black grid lines.
- theme_minimal(): A clean theme with minimal grid lines.
- theme_classic(): A classic-looking theme with a simple design.
- theme_void(): A theme without axes, titles, or grid lines, often used for background images.
You can also create custom themes by modifying elements within the existing themes.
Rotating X-Axis Labels
When you have long x-axis labels or a large number of categories, it can be challenging to display them clearly. Rotating x-axis labels can enhance readability and prevent overlapping.
1: Using theme() to Rotate Labels
You can rotate x-axis labels using the theme() function in conjunction with the element_text() function. The angle parameter controls the rotation of the labels.
# Load required packages
library(ggplot2)

# Create sample data
data <- data.frame(
  category = c("Category 1", "Category 2", "Category 3", "Category 4", "Category 5", "Category 6"),
  value = c(3, 7, 2, 5, 8, 4)
)

# Create a bar plot with rotated x-axis labels
ggplot(data, aes(x = category, y = value)) +
  geom_bar(stat = "identity", fill = "steelblue") +
  theme_minimal() +
  theme(axis.text.x = element_text(angle = 45, hjust = 1)) +
  labs(title = "Rotated X-Axis Labels in ggplot2",
       x = "Categories",
       y = "Values")
Output:

theme(axis.text.x = element_text(angle = 45, hjust = 1)): Rotates the x-axis labels by 45 degrees. The hjust parameter adjusts the horizontal justification, with 1 meaning the text is right-aligned. You can set hjust = 0.5 for center alignment or hjust = 0 for left alignment.
2: Rotating Labels to Vertical
If the labels are particularly long, you might consider rotating them to vertical (90 degrees) for even better readability.
# Create a bar plot with vertical x-axis labels
ggplot(data, aes(x = category, y = value)) +
  geom_bar(stat = "identity", fill = "steelblue") +
  theme_minimal() +
  theme(axis.text.x = element_text(angle = 90, vjust = 0.5, hjust = 1)) +
  labs(title = "Vertical X-Axis Labels in ggplot2",
       x = "Categories",
       y = "Values")
Output:
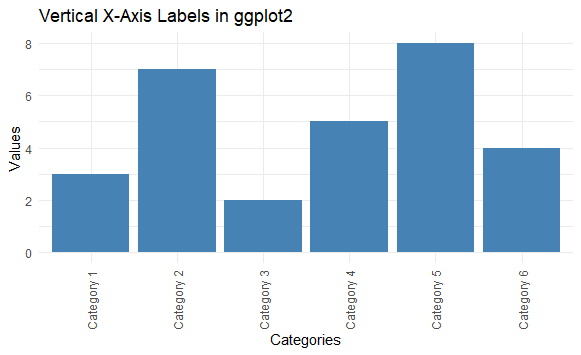
angle = 90: Rotates the labels to be vertical.vjust = 0.5: Centers the text vertically.
Changing Themes in ggplot2
Changing the theme of a plot can significantly alter its look and feel. You can easily apply a different theme by calling it after the ggplot function.
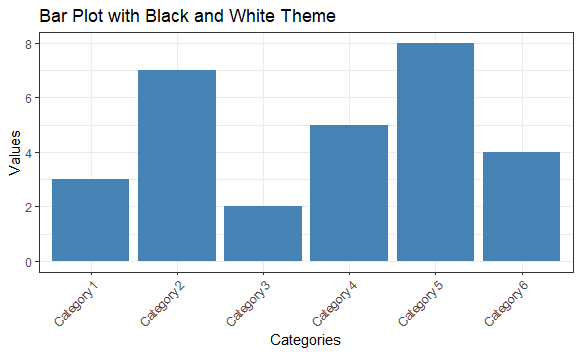
1: Changing Themes in ggplot2 Using Built-in Themes
First we will Changing Themes in ggplot2 Using Built-in Themes.\
# Create a bar plot with different themes
ggplot(data, aes(x = category, y = value)) +
  geom_bar(stat = "identity", fill = "steelblue") +
  theme_bw() +  # Changing to black and white theme
  theme(axis.text.x = element_text(angle = 45, hjust = 1)) +
  labs(title = "Bar Plot with Black and White Theme",
       x = "Categories",
       y = "Values")
Output:
2: Creating a Custom Theme
You can also create your own theme by modifying existing themes to suit your specific needs.
# Create a custom theme
custom_theme <- theme(
  panel.background = element_rect(fill = "lightgray"),
  panel.grid.major = element_line(color = "white"),
  panel.grid.minor = element_blank(),
  axis.text.x = element_text(angle = 45, hjust = 1),
  axis.title = element_text(size = 12, face = "bold"),
  plot.title = element_text(hjust = 0.5, size = 14, face = "bold")
)

# Create a bar plot with a custom theme
ggplot(data, aes(x = category, y = value)) +
  geom_bar(stat = "identity", fill = "steelblue") +
  custom_theme +
  labs(title = "Bar Plot with Custom Theme",
       x = "Categories",
       y = "Values")
Output:
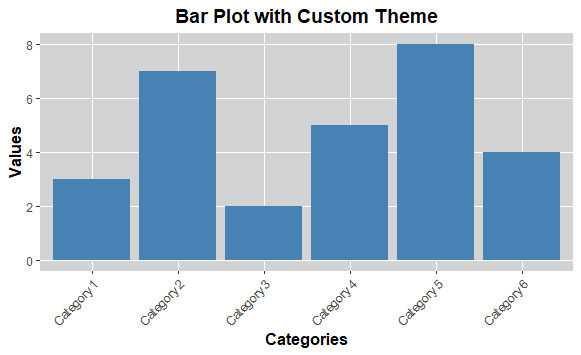
element_rect(fill = "lightgray"): Sets the background color of the panel.element_line(color = "white"): Changes the color of the major grid lines.element_blank(): Removes minor grid lines.axis.titleandplot.title: Customize the text size and font style.
Conclusion
Rotating x-axis labels and changing the theme in ggplot2 are essential skills for improving the clarity and aesthetics of your visualizations. By making the text readable and selecting an appropriate theme, you can significantly enhance your plots' effectiveness in conveying information. With ggplot2's flexibility, you can tailor your visualizations to meet your specific needs and style preferences.
