An infographic is a visual tool that combines images, charts, and text to present information clearly and quickly. It helps make complex data easy to understand by breaking it down into simple, engaging visuals. Infographics are used in various fields, from education to marketing, to convey messages effectively and attractively. In this article, we'll explore what an infographic is, its benefits, and how you can use it to communicate information better.

Table of Content
What is an Infographic?
An infographic is a visual tool that combines images, charts, and text to present information in a clear and engaging way. It simplifies complex data and concepts, making them easy to understand at a glance. Infographics are designed to quickly communicate information and are often used in education, marketing, and business to share data and insights effectively.
By turning dense information into visually appealing graphics, infographics help capture attention and make learning more enjoyable. They are an effective way to convey messages, highlight key points, and make data more accessible to a wide audience.
Why use Infographics?
Simplifies Complex Information
Infographics break down complicated data into easy-to-understand visuals.
Engages the Audience
Eye-catching graphics and concise information capture and hold viewers' attention.
Enhances Understanding
Visual representations help people grasp and remember information better than text alone.
Improves Communication
Infographics convey messages quickly and clearly, making them ideal for presentations and reports.
Boosts Sharing
Attractive and informative infographics are more likely to be shared on social media and other platforms.
Increases Visibility
Well-designed infographics can help increase the visibility and reach of your content.
Supports Branding
Consistent use of infographics can strengthen brand identity and make your content more recognizable.
Types of Infographics
There are nine main types of infographics, each serving a different purpose:
1. Statistical Infographics
These infographics display data and statistics in a visual way, making numbers easy to understand.
2. Informational Infographics
These infographics explain a concept or provide an overview of a topic using text and visuals.
3. Timeline Infographics
These show the sequence of events over time, helping to illustrate a historical timeline or project schedule.
4. Process Infographics
These outline the steps of a process, making it easier to understand how something works or how to do something.
5. Geographic Infographics
These use maps and charts to provide information about locations, such as demographics or travel routes.
6. Comparison Infographics
These highlight the differences and similarities between two or more items, helping to compare features or data.
7. Hierarchical Infographics
These show the levels of a hierarchy or organization, such as company structure or ranking systems.
8. List Infographics
These present information in a list format, making it easy to see key points and details.
9. Resume Infographics
These turn a traditional resume into a visually engaging format, showcasing skills, experience, and achievements.
How to Create an Infographic?
Creating an infographic is not that difficult if you have a clear idea what you want to represent. You can create an infographic by following these steps:
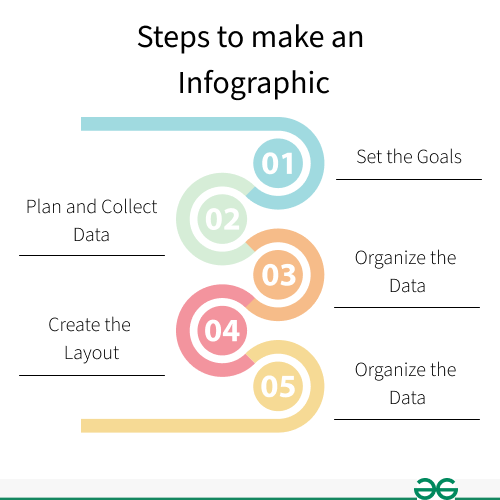
Step 1- Set the Goals for your Infographic:
First set the attainable goals for the infographic design. It will be very difficult to design if you dont know what you want to represent and what your goals are.
Step 2- Plan and collect data for the content:
Collect the data you have and if not. Then can just simply start research on Google. There is a lot of data available for the public on the internet.
Step 3- Organize and visualize your data:
Now start organizing the data you collect and visualize what kind of infographic you want including groups, patterns, rank or order.
Step 4- Choose a template or create your layout:
Start creating the layout and design. One simple tactic that instantly increases your infographic is to lay out the elements in a predefined symmetrical grid.
Step 5- Add visual elements to make it stand out:
Now, here comes the fun part. Adding design elements to your infographic to make it visually pleasant. Don't put too much elements, just try to keep it simple.
Now, you have a basic idea to create your first infographic design.
Importance of Using Visual Elements in an Infographic
The main purpose of infographics is to make information visually appealing. Without visual elements, infographics would just be plain text, and most people find plain text boring. Visual elements are crucial for grabbing the audience's attention and making the information easy to understand. Here are some commonly used visual elements in infographics:
- Colors: Make the infographic attractive and highlight important information.
- Fonts: Ensure the text is readable and adds style to the design.
- Layout: Organizes information in a clear and logical way.
- Images and Graphics: Illustrate data and concepts, making them easier to grasp.
What Makes an Infographic Design Effective?
Infographics are used to communicate information to the people and sometimes the information can be very complex. A good infographic should be very clear, easy to understand and shouldn't confuse people. It should be well designed and tell a clear story to your audience. There should not be any mystery in your story and the layout shoud not be very busy. Use a short and simple title that is catchy enough to grab the audience attention. Use the right fonts and colors that compliments your infographic. Don't forget to promote your work. After completing the infographic upload it and share it on social media. Provide a link and call-to-action so peole can easily share your work.
