


If you spend a lot of time working with numbers, you might have tried several apps and programs to process data, only to realize that Microsoft Excel is the undisputed king. There are lots of factors that contribute to this notion, including cross-platform support, a handy mobile app, built-in templates, and powerful features that enable you to create dashboards, compare databases, etc. Excel also supports integrations with programming languages, which means you can use Python with Excel to further enhance its capabilities. While that's already a boon for power users, I recently discovered another integration that takes working inside Excel to the next level. It's a Jupyter extension that can ease your workflow and save you a significant amount of time and effort.
For those unaware, Jupyter Notebook is a web-based development environment that lets programmers arrange and configure their workflows when programming. The extension links Jupyter Notebook with Microsoft Excel seamlessly, unlocking a host of possibilities for what you can do with processing data inside Excel. Whether you perform simple calculations, prepare balance sheets, or analyze finances for businesses, here's why you absolutely need to add an instance of Jupyter Notebook to your Excel workflow right away.
What is PyXLL-Jupyter?
How is it different from native Python in Excel?

Some of you may be aware that you can run Python in Excel natively. However, it is dependent on a cloud-based Anaconda environment to execute code. On the other hand, PyXLL-Jupyter operates locally, on your device. This gives you total control over your Python environment and data. As a result, your code executes faster without any latency, there's no dependency on the internet, and your privacy is upheld, since no data is sent to cloud servers. Apart from this, there are a few other workflow-related benefits that make the extension worth having.
For instance, PyXLL-Jupyter can integrate data from your Excel workbook into a Jupyter Notebook using a single command. This enables you to analyze massive datasets quickly. Additionally, PyXLL-Jupyter also has better visualization in places where Excel's native graphs and charts fail to deliver. Then, there's the ability to create custom functions that you can use as formulas within Excel, real-time results when experimenting with code, and the versatile use case, which makes it suitable for everything from financial forecasting to building interactive dashboards. To install the extension, run the following commands in your terminal or PowerShell window with Python installed.
pip install pyxll
pip install pyxll-jupyter
pyxll install
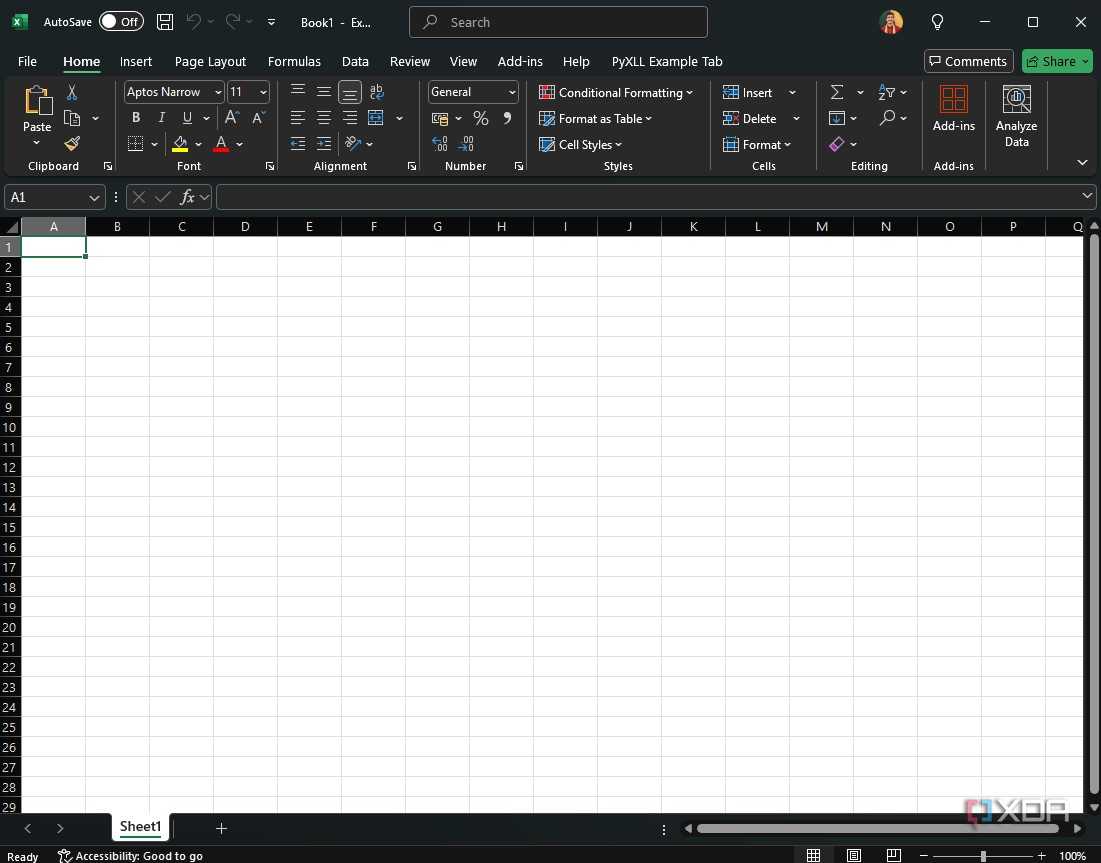
Open Excel, and you will see a new tab in the ribbon at the top that says PyXLL.
Some cool use cases
Perform tasks with better efficiency

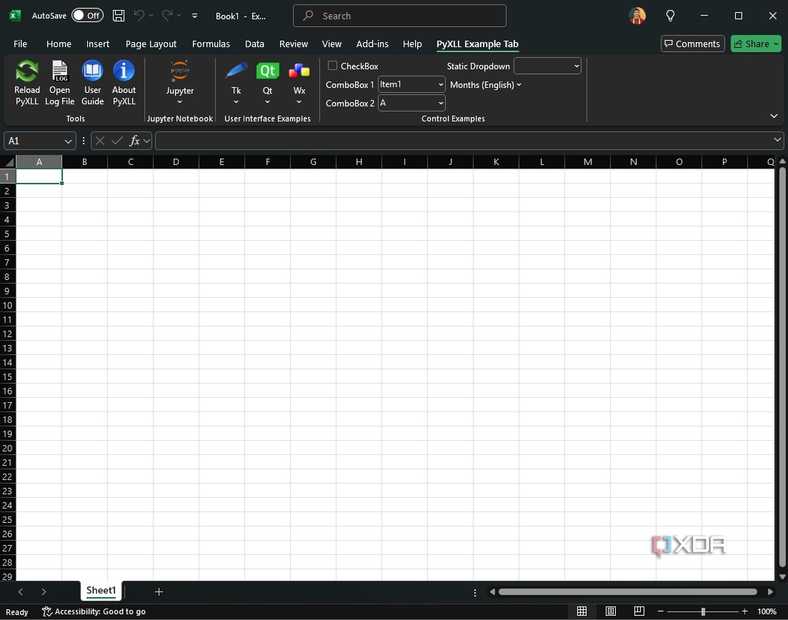

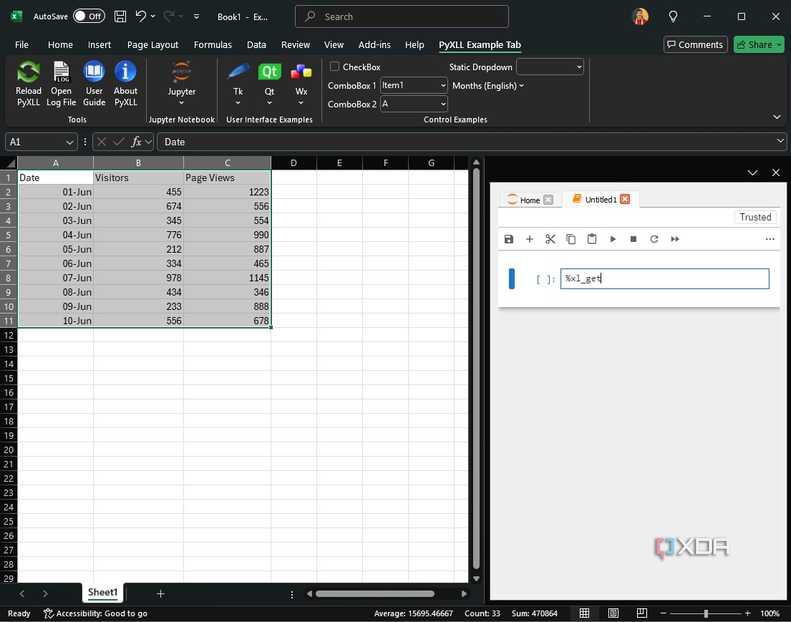
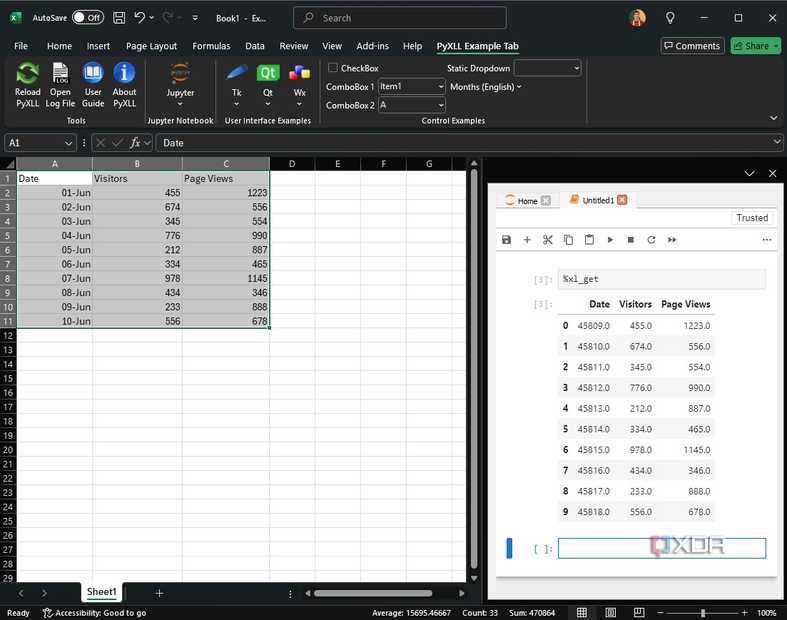


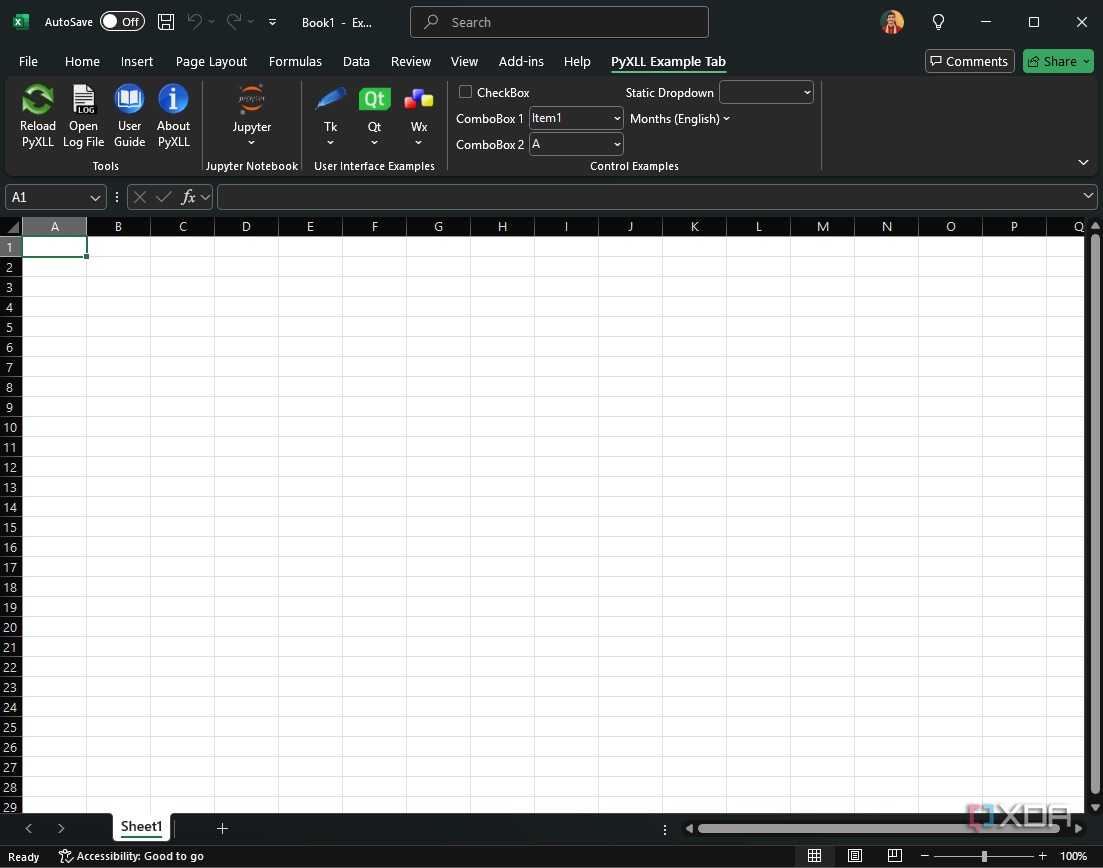
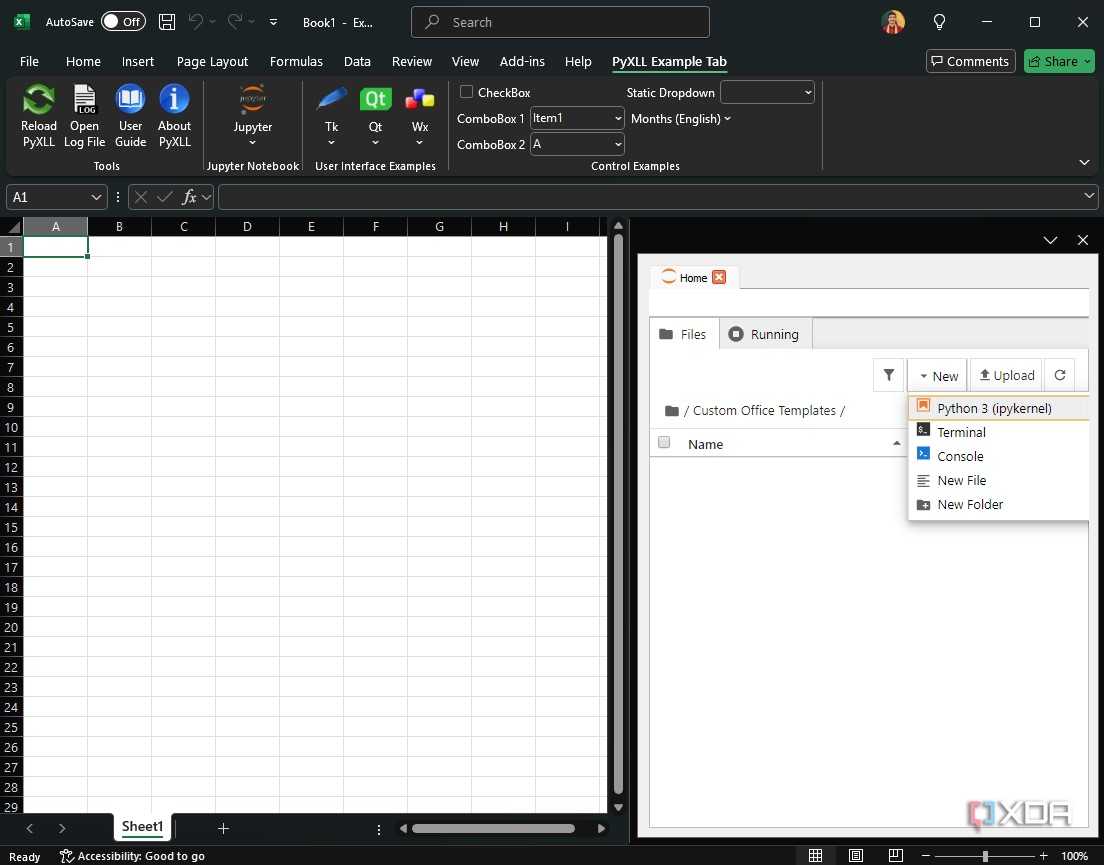
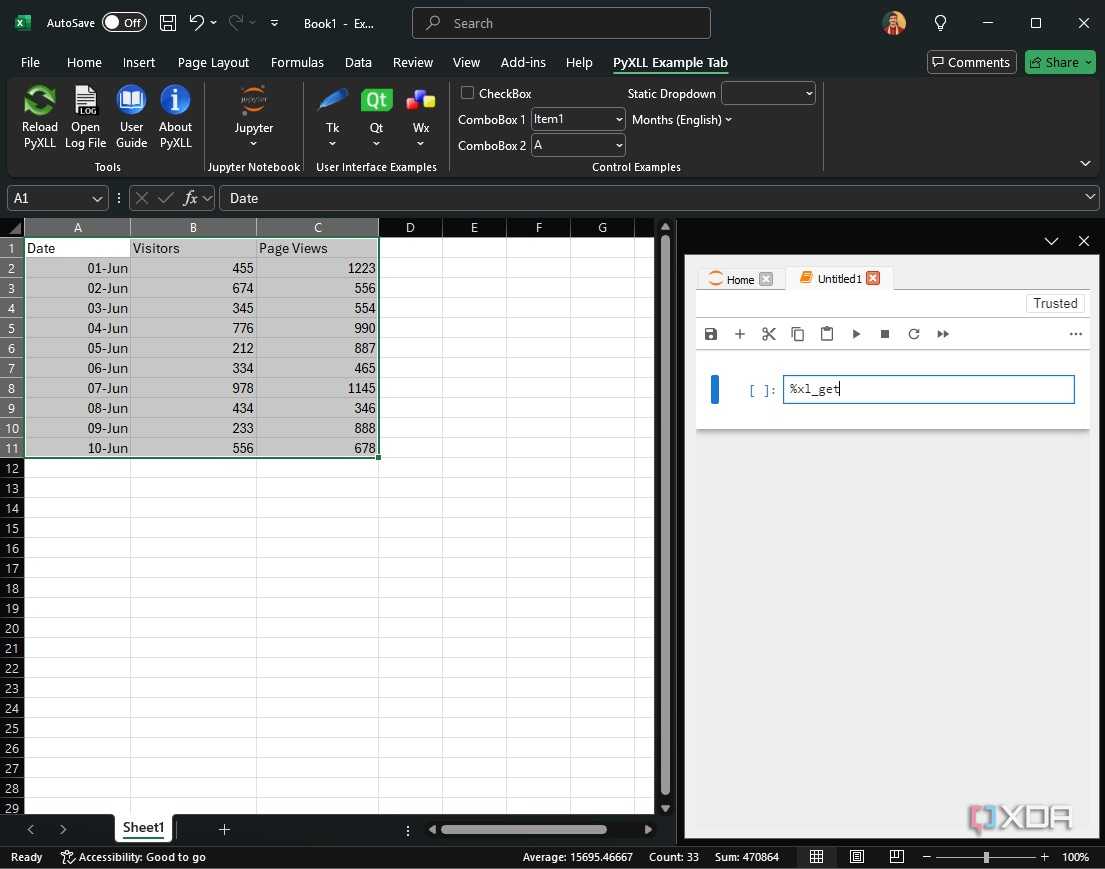
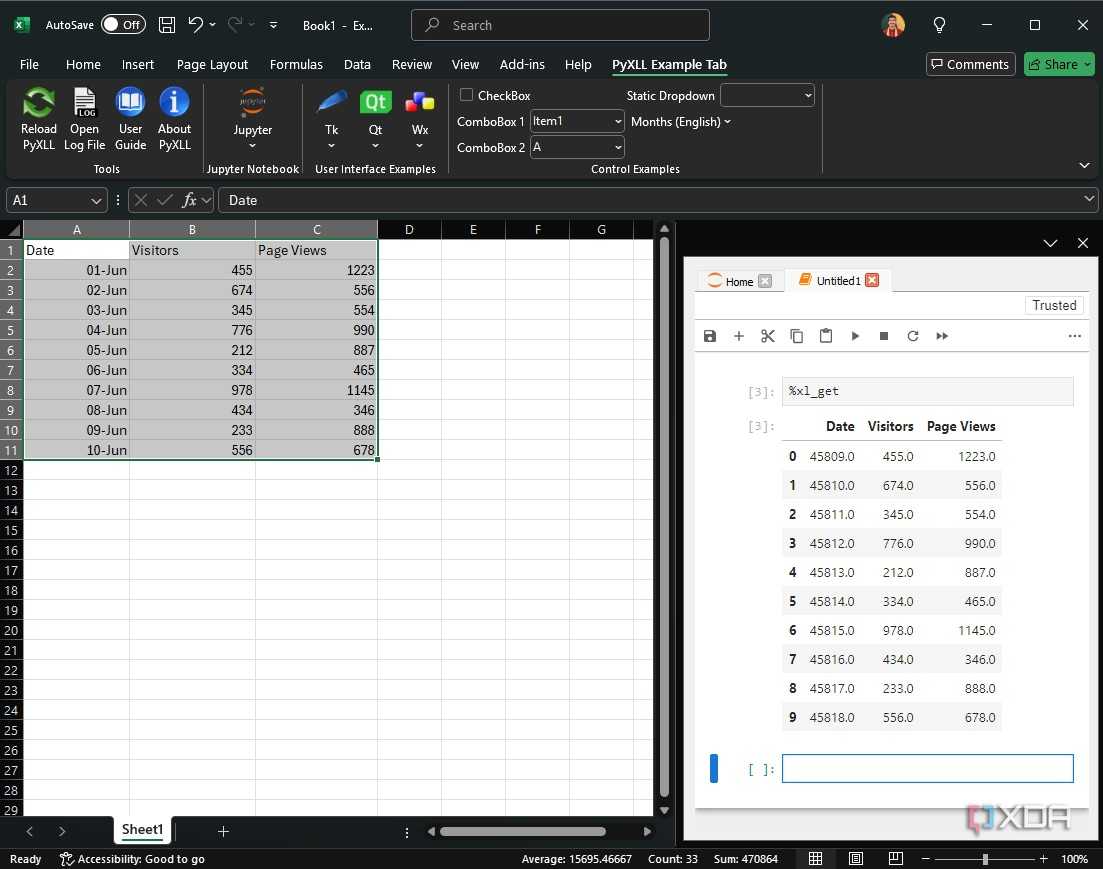
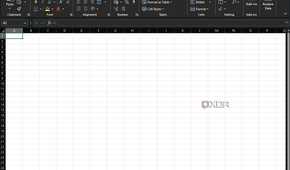
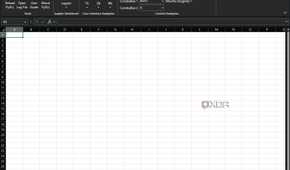
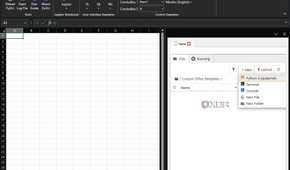
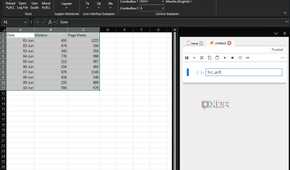
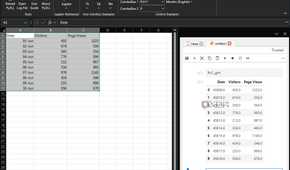
Once you have everything running, switch to the PyXLL tab inside Excel to access all the different options. When you click on Jupyter, it launches a notebook inside Excel where you can enter programs to execute inside Excel. The best usage of this is to extract data from the spreadsheet and use programs to make your job easier. For instance, I have a table with some data. I want to derive the mean, median, or other statistical measures from it, and also create graphs or charts to represent the data. In such instances, all I have to do is select the data in Excel and write Python scripts inside the Jupyter Notebook to perform the relevant function.
After selecting the data, use the following code to import the data into Jupyter.
%xl_get
You can then perform different actions once you have the data. For instance, let's say you have a table consisting of various products and their revenue. Using the following code, you can generate a bar graph and analyze the data.
%xl_get
import pandas as pd
df = pd.DataFrame(xl_get)
df.groupby('Product')['Revenue'].sum().plot(kind='bar', title='Product Revenue')
Similarly, you can go one step further and make a financial dashboard for each quarter using the following code:
%xl_get
import pandas as pd
import plotly.express as px
df = pd.DataFrame(xl_get)
fig = px.bar(df, x='Quarter', y='Revenue', color='Product', title='Sales by Quarter')
fig.show()
Python's NLTK library also helps you analyze customer feedback, which is helpful if you work in the sales department. Use the following code with the relevant data:
%xl_get
from nltk.sentiment import SentimentIntensityAnalyzer
import pandas as pd
sia = SentimentIntensityAnalyzer()
df = pd.DataFrame(xl_get)
df['Sentiment'] = df['Feedback'].apply(lambda x: sia.polarity_scores(x)['compound'])
%xl_set df
The possibilities are endless. You can explore multiple ways in which you can use Python to extract information from your data.
Get the best out of Excel
Data analysts, accountants, and even students who regularly use Excel will certainly benefit from integrating PyXLL-Jupyter with Excel. It eases out the workflow in the long run by enabling you to execute Python commands quickly and with less friction. The biggest advantage that it provides is that it runs locally on your machine, so there's no dependence on the internet. This way, you can continue to crunch those numbers while the entire data stays offline, and you don't even have to worry about spotty connections.
