VisBuilder
VisBuilder provides drag-and-drop visualization creation in OpenSearch Dashboards. With VisBuilder you have:
- An immediate view of your data without the need to preselect the visualization output.
- The flexibility to change visualization types and index patterns quickly.
- The ability to easily navigate between multiple screens.
When to use VisBuilder
Use VisBuilder for rapid exploration of data relationships through an intuitive drag-and-drop interface, reducing the time required to test hypotheses and explore data patterns without needing query language knowledge.
Creating a visualization using VisBuilder
The examples on this page use the Sample flight data dataset. Before you begin, complete the prerequisites.
To create a visualization using VisBuilder, follow these steps:
-
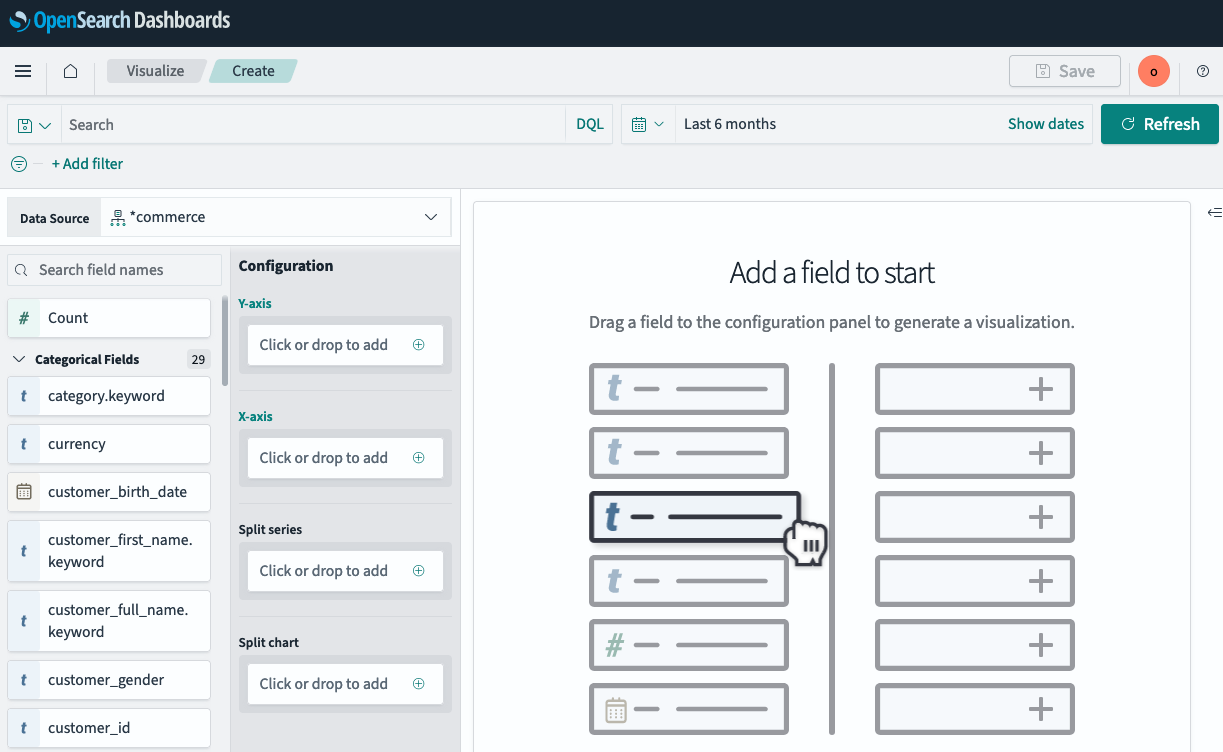
In the New Visualization dialog, select VisBuilder, as shown in the following image.
- From the Data Source dropdown, select opensearch_dashboards_sample_data_flights.
- In the Configuration panel, add fields to the chart by dragging them from the field list on the left or by selecting the + icon in each section:
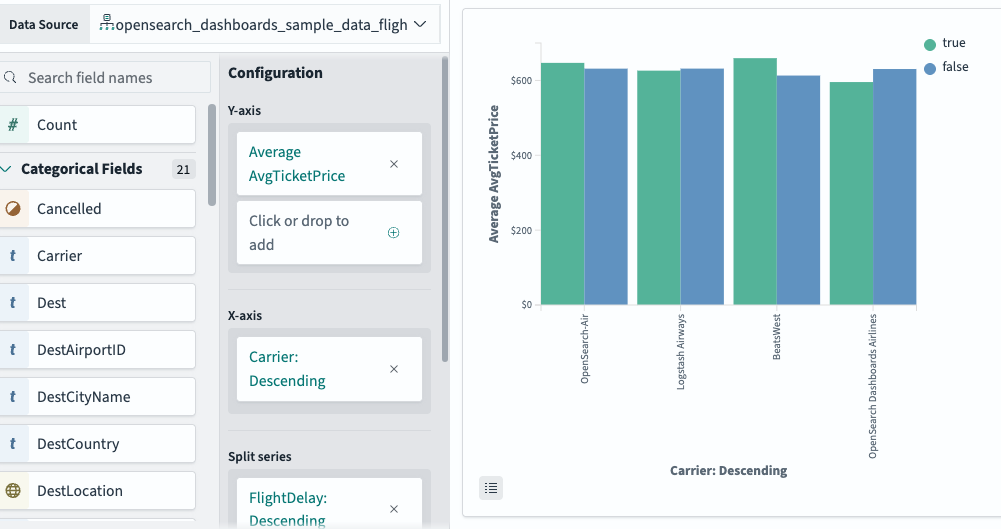
- Y-axis: Select the + icon, set Aggregation to Average, and set Field to AvgTicketPrice.
- X-axis: Select the + icon, set Aggregation to Terms, set Field to Carrier, and set Order to Descending.
- Split series: Select the + icon, set Aggregation to Terms, and set Field to FlightDelay.
The chart updates automatically as you add fields. The Split series field divides each bar into color-coded subgroups. In this example, FlightDelay has two values (true and false), so each carrier shows two bars—one for delayed flights and one for non-delayed flights—in different colors, as shown in the following image.
Next steps
- To choose a different visualization type, see Choosing a visualization type.
- To add this visualization to a dashboard, see Creating dashboards.
