The htop command is an interactive process monitoring tool in Linux used to view and manage system resources in real time. It is an improved version of the top command, offering a more user-friendly interface with better visualization and control.
- Monitor CPU, memory, and swap usage in real time
- View and manage running processes interactively
- Sort, filter, and search processes easily
- Display process hierarchy (tree view)
- Support keyboard and mouse interactions
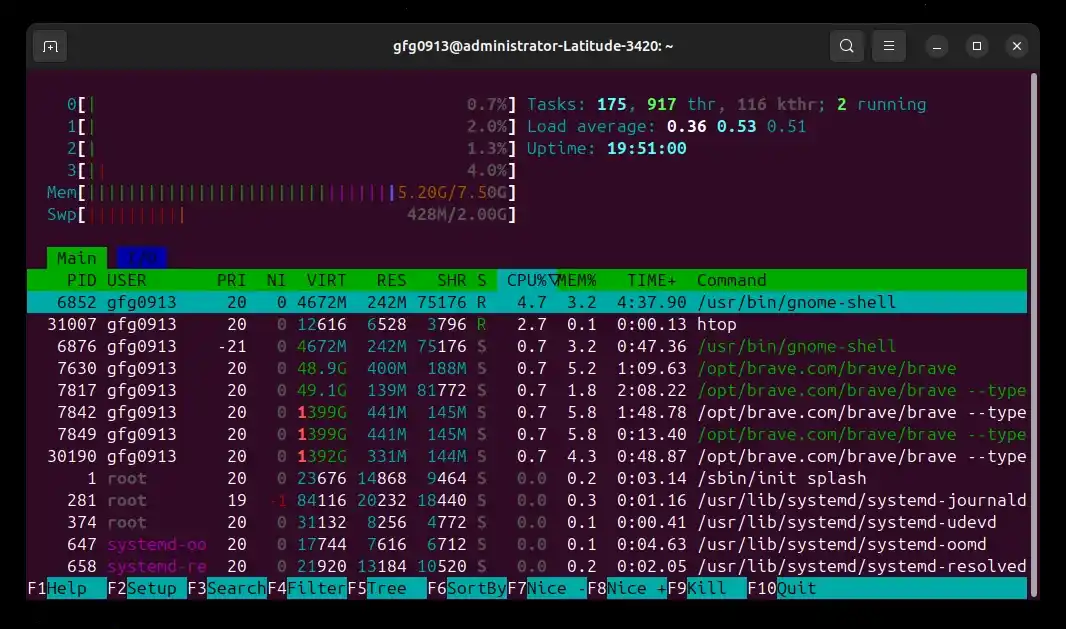
To open the interactive process monitoring interface.
Command:
htopOutput:
Syntax
htop [options]- htop: Command name
- [options]: Optional flags to modify behavior
Common Options Used With htop Command
1. -d: Set Update Delay
Sets the delay between screen updates (in tenths of a second), which helps reduce frequent refreshes and makes the display easier to read while lowering CPU usage.
Command:
htop -d 10- -d: Specifies update interval
- 10: 1.0 second delay (value is in tenths)
Output:
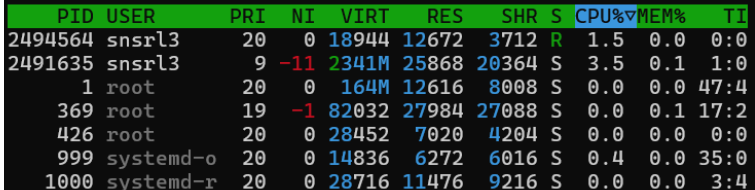
2. -u: Display Processes of a Specific User
Displays only the processes owned by a specific user, which is useful when monitoring or troubleshooting activity related to a particular account.
Syntax:
htop -u <user>- <user>: Username whose processes will be displayed
Example Command:
htop -u kunwarvikasOutput:

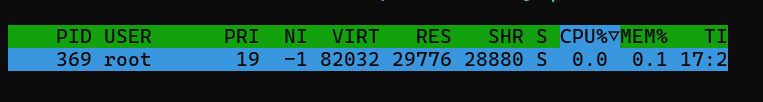
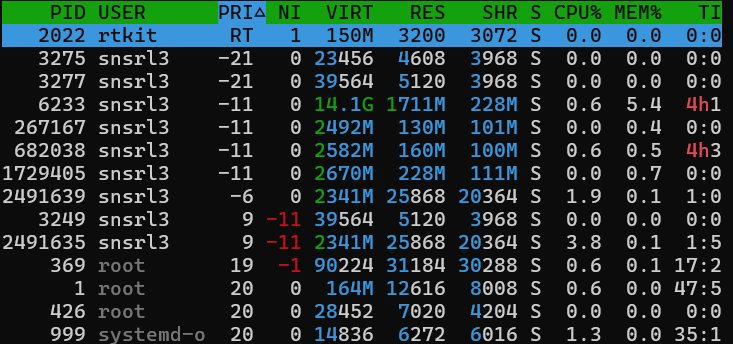
3. -p: Display Specific Process IDs
Shows only the specified process IDs, allowing you to focus on monitoring selected processes instead of the entire system.
Syntax:
htop -p <pid1,pid2>- <pid1,pid2>: One or more process IDs, specified as a comma-separated list.
Example:
htop -p 369Output:
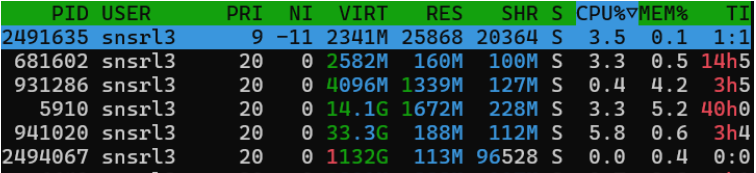
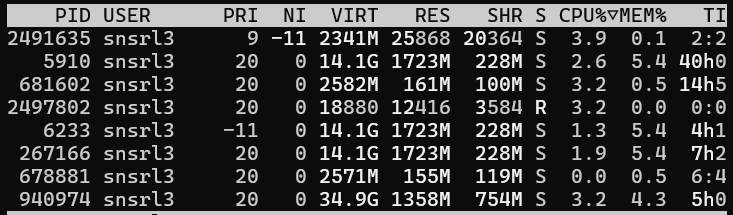
4. -s: Sort Processes by Column
Sorts processes based on a specified column, helping quickly identify processes consuming high CPU, memory, or other resources.
Syntax:
htop -s <column>- <column>: Column name (e.g., PERCENT_CPU, PERCENT_MEM)
Example Command:
htop -s PRIORITYOutput:
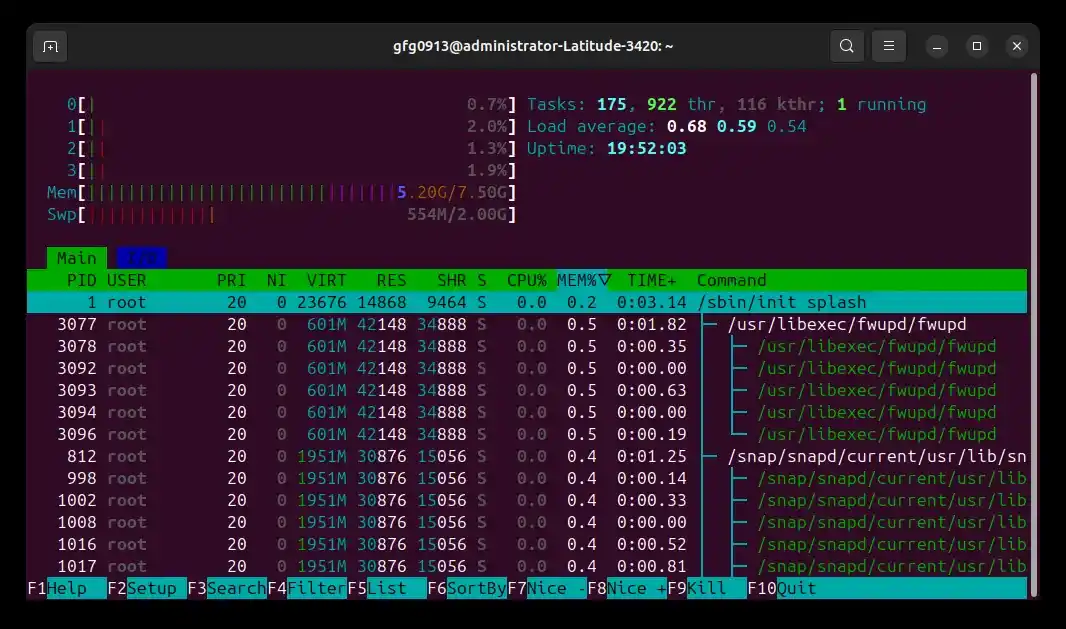
5. -t: Display Process Tree View
Displays processes in a hierarchical tree view, making it easier to understand parent-child relationships between processes.
Example: Display Process Tree View
To visualize parent-child relationships between processes.
Command:
htop -tOutput:
6. --no-color: Disable Colored Output
Runs htop in monochrome mode by disabling colored output, which is useful in terminals that do not support colors.
Command:
htop --no-colorOutput:
7. -v / --version: Display Version Information
Displays the installed version of htop, which is useful for verifying compatibility or troubleshooting.
Command:
htop --versionOutput:

Interactive Controls in htop
htop provides keyboard shortcuts for easy navigation and process management.
Navigation Keys:
- Arrow Keys: Move through process list
- Page Up / Page Down: Scroll pages
- Home / End: Jump to start or end
Process Selection:
- Space: Tag or untag a process
- U: Untag all processes
- s: Trace system calls of a process
Function Keys:
- F1: Help
- F2: Setup (customize display)
- F3: Search process
- F4: Filter processes
- F5: Tree view
- F6: Sort processes
- F7: Increase priority (nice value)
- F8: Decrease priority
- F9: Kill process
- F10: Quit
Output:

