Motion is one of the fundamental concepts in physics, and understanding it becomes much easier when it is represented graphically. Instead of only relying on equations and numerical values, graphs provide a visual interpretation of how an object moves over time. The graphical representation of motion helps us analyze relationships between physical quantities such as displacement, velocity, acceleration, and time.
In physics, motion is described in terms of how position changes with time. Graphs are powerful tools that allow us to visualize this change. The most commonly used graphs in motion are
- Displacement–Time (Position–Time) Graph
- Velocity–Time Graph
- Acceleration–Time Graph
Each of these graphs provides different information about the motion of an object.
1. Displacement-Time Graphs
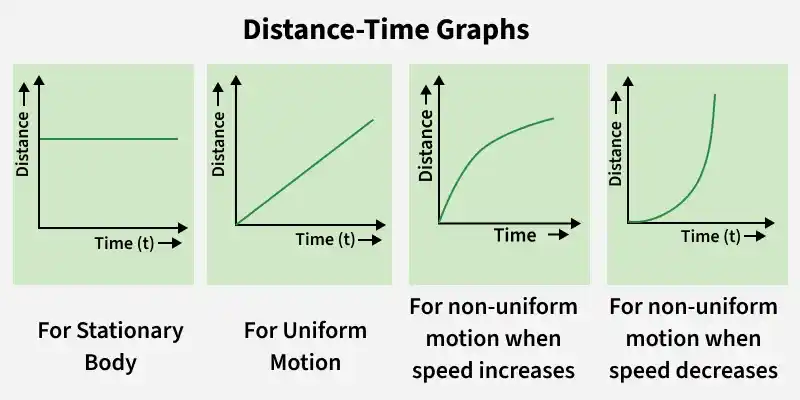
A displacement–time graph shows how the position of an object changes over time.
- Time is taken on the x-axis, and displacement on the y-axis.
- The slope of the graph represents velocity.
Key Observations:
- Straight line (constant slope): Uniform motion (constant velocity)
- Horizontal line: Object is at rest (no change in position).
- Curved line: Non-uniform motion (changing velocity)
This graph helps us understand whether an object is moving steadily or changing its speed.
2. Velocity-Time Graphs
A velocity–time graph shows how velocity changes with time.
- Time is on the x-axis, and velocity is on the y-axis.
- The slope of the graph represents acceleration.
- The area under the graph gives displacement.
Key Observations:
- Straight line parallel to time axis: Constant velocity
- Straight line with slope: Uniform acceleration
- Curve: Non-uniform acceleration
This graph is especially useful in studying accelerated motion.
3. Acceleration-Time Graphs
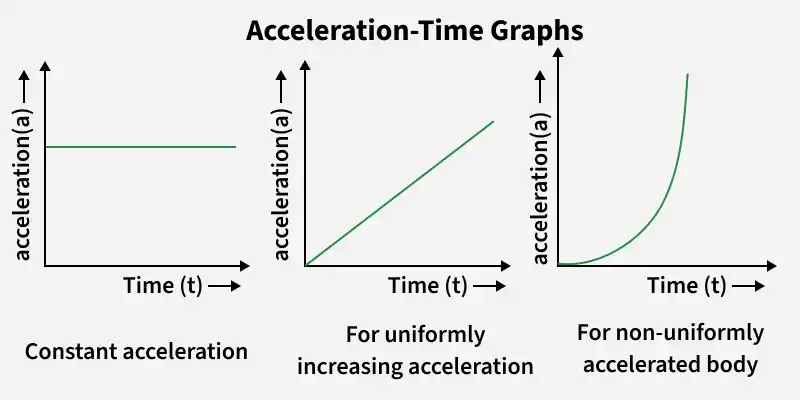
An acceleration–time graph represents how acceleration varies with time.
- Time is on the x-axis, and acceleration is on the y-axis.
- The area under the graph gives the change in velocity.
Key Observations:
- Horizontal line: Constant acceleration
- Line along time axis: Zero acceleration (constant velocity)
This graph is useful for understanding how forces affect motion.
Importance of Graphical Representation
Graphical representation of motion is important because:
- It simplifies complex motion into visual form.
- Helps in quick analysis and comparison.
- Makes it easier to calculate velocity, acceleration, and displacement.
- Widely used in experiments and real-life applications
