Data visualization is actually a set of data points and information that are represented graphically to make it easy and quick for user to understand. Data visualization is good if it has a clear meaning, purpose, and is very easy to interpret, without requiring context. Tools of data visualization provide an accessible way to see and understand trends, outliers, and patterns in data by using visual effects or elements such as a chart, graphs, and maps.
Characteristics of Effective Graphical Visual :
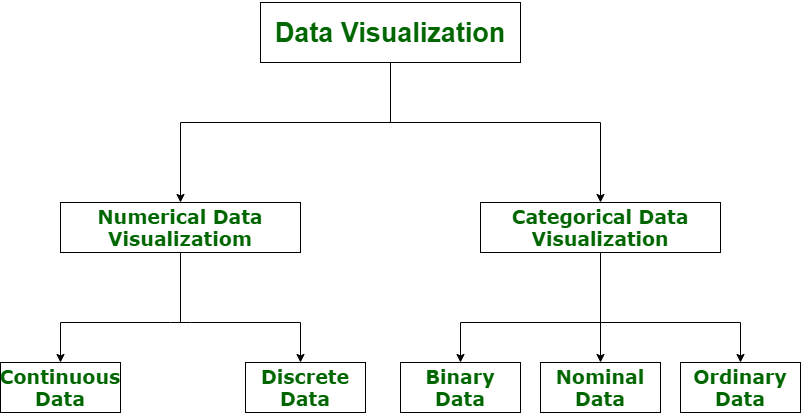
Figure - Categories of Data Visualization
- It shows or visualizes data very clearly in an understandable manner.
- It encourages viewers to compare different pieces of data.
- It closely integrates statistical and verbal descriptions of data set.
- It grabs our interest, focuses our mind, and keeps our eyes on message as human brain tends to focus on visual data more than written data.
- It also helps in identifying area that needs more attention and improvement.
- Using graphical representation, a story can be told more efficiently. Also, it requires less time to understand picture than it takes to understand textual data.
- Numerical Data :
Numerical data is also known as Quantitative data. Numerical data is any data where data generally represents amount such as height, weight, age of a person, etc. Numerical data visualization is easiest way to visualize data. It is generally used for helping others to digest large data sets and raw numbers in a way that makes it easier to interpret into action. Numerical data is categorized into two categories :
- Continuous Data - It can be narrowed or categorized (Example: Height measurements).
- Discrete Data - This type of data is not “continuous” (Example: Number of cars or children’s a household has).
- Categorical Data :
Categorical data is also known as Qualitative data. Categorical data is any data where data generally represents groups. It simply consists of categorical variables that are used to represent characteristics such as a person’s ranking, a person’s gender, etc. Categorical data visualization is all about depicting key themes, establishing connections, and lending context. Categorical data is classified into three categories :
- Binary Data - In this, classification is based on positioning (Example: Agrees or Disagrees).
- Nominal Data - In this, classification is based on attributes (Example: Male or Female).
- Ordinal Data - In this, classification is based on ordering of information (Example: Timeline or processes).
