Pinned
IEEE VIS
2,232 posts

IEEE VIS
@ieeevis
The premier forum for visualization advances for academia, government, and industry. We invite you to share your research, insights, and enthusiasm at IEEE VIS
 I hope that you had a good #ieeevis 2019! Videos of the presentations are online. vimeo.com/showcase/65241… keynote: vimeo.com/368708656 Best Papers: VAST: vimeo.com/368702648 InfoVis: vimeo.com/368703151 SciVis: vimeo.com/368709571 Short: vimeo.com/368703866
- Data-GIFs are popular online, which embed visual messages in short animation and are played in loops. New work shows rich examples and design suggestions by @shuxinhuan Aoyu Wu, @JunxiuT @benjbach Yingcai Wu, Huamin Qu. See our website: data-gifs.github.io #ieeevis
 GIF
GIF - Tired of blindly tweaking layout parameters to visualize your network? This #MachineLearning model builds an intuitive interface for you to produce a layout you want! Paper and demo: kwonoh.net/dgl @OhHyunKwon @KwanLiuMa #IEEEVIS
- Also an update about #ieeevis registration: while we are still finalizing details, registration for (virtual) attendees will be free, with a registration fee for presenters and contributors.
- Overjoyed to share that @tamaramunzner has been honored with the prestigious #IEEEVIS Service Award! Her exceptional dedication and invaluable contributions to the VIS community have made it what it is today. Congratulations Tamara, this accolade is richly deserved! 🎉

- Update: We will be moving to a totally virtual conference for #ieeevis this year. More details at: ieeevis.org/year/2020/info…
- A huge round of applause to our incredible #IEEEVIS student volunteers! 🎉 This event wouldn't be possible without your dedication and hard work. Your smiles in this group photo say it all. Here's to you, the backbone of our conference! 🙌

- That's a wrap on #ieeevis! Thanks everyone for a successful and enriching VIS 2020! Hope you will join us next year!
- What strategies do chart users rely on to make judgments and decisions with uncertainty visualizations? Find out in the InfoVis 2020 Best Paper from @AlexKale17, @mjskay, and @JessicaHullman. #ieeevis Preprint: arxiv.org/abs/2007.14516
 GIF
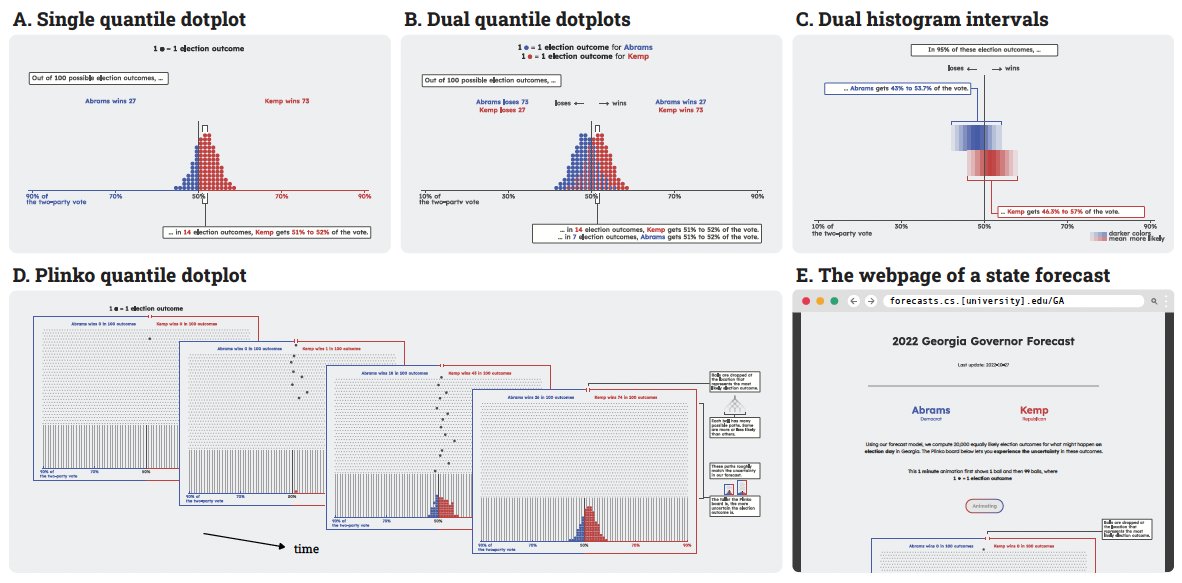
GIF - BEST PAPER 🏆: Swaying the Public? Impacts of Election Forecast Visualizations on Emotion, Trust, and Intention in the 2022 U.S. Midterms @fumeng_yang, @MandiCai, @ChloeMortenson, H. Fakhari, A. Lokmanoglu, @JessicaHullman, @SteveFranconeri, @ndiakopoulos, E. Nisbet, @mjskay
- People conflate correlation with causation when drawing conclusions about data. We show that visualization design choices can influence the strength of causal conclusions. arxiv.org/pdf/1908.00215… @thecindyxiong @joelkshapiro @JessicaHullman @SteveFranconeri #ieeevis


