Linux provides a variety of commands and tools that allow administrators to track key metrics in real-time or over time. These tools help analyze CPU, memory, disk I/O, network activity and processes to ensure efficient system operation.
- Track system resource usage (CPU, memory, disk, network).
- Identify processes consuming high resources.
- Detect bottlenecks and potential system issues.
- Monitor system performance trends over time.
- Facilitate proactive troubleshooting and optimization.
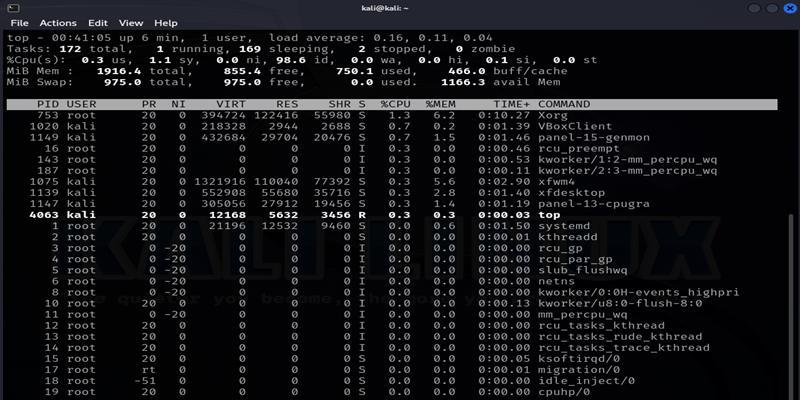
1. top command
The top command is used to display real-time information about running processes and system resource usage. It provides a dynamic, continuously updating view of CPU, memory and process activity, making it one of the most commonly used monitoring tools in Linux.
- Monitor CPU and memory usage in real time.
- Identify resource-intensive processes.
- Track system load and uptime.
- View process details such as PID, user and command.
Example: Monitor real-time processes
Monitor system processes and resource usage in real time. Displays a continuously updating table of processes sorted by CPU usage by default.
Command:
topOutput:
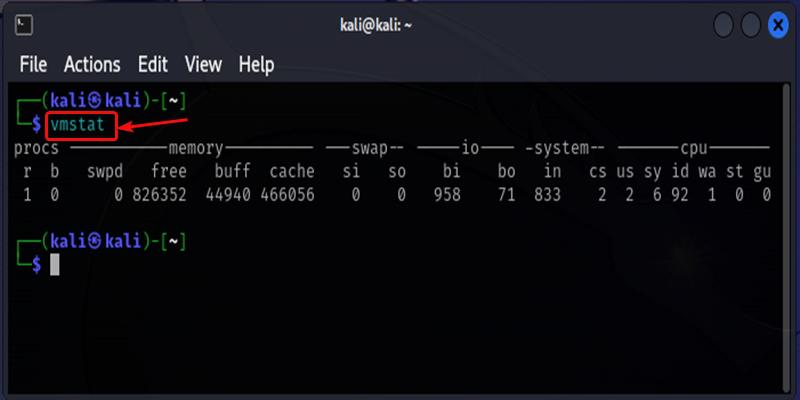
2. vmstat command
The vmstat (Virtual Memory Statistics) command is used to monitor system performance related to memory, CPU, processes and I/O activity. It provides snapshots of system statistics and helps identify performance bottlenecks over time.
- Monitor memory and swap usage.
- Analyze CPU activity and idle time.
- Detect disk I/O bottlenecks.
- Observe system performance trends over intervals.
Example: View system memory and CPU snapshots
View a snapshot of system performance metrics. Displays information about processes, memory usage, swap, I/O, system interrupts and CPU activity.
Command:
vmstatOutput:
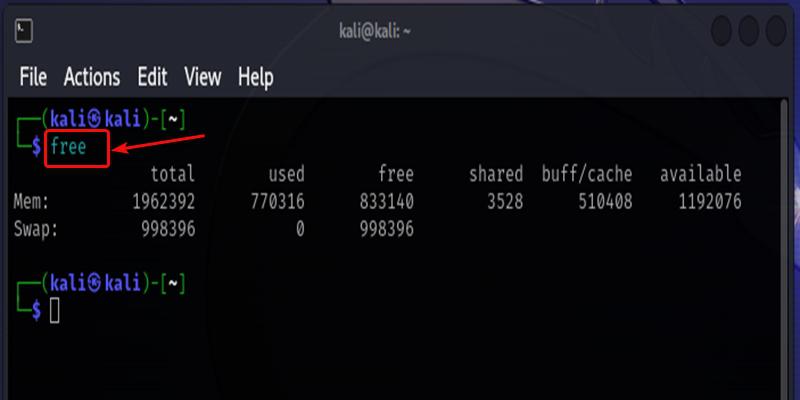
3. free command
The free command is used to display information about system memory usage, including total, used and free physical memory, as well as swap memory. It provides a quick overview of how memory is being utilized.
- Check total and available system memory.
- Monitor used and free RAM.
- View swap memory usage.
- Quickly diagnose memory-related issues.
Example: Check current memory usage
Display current memory usage of the system. Shows memory statistics in a tabular format, including RAM and swap details.
Command:
freeOutput:
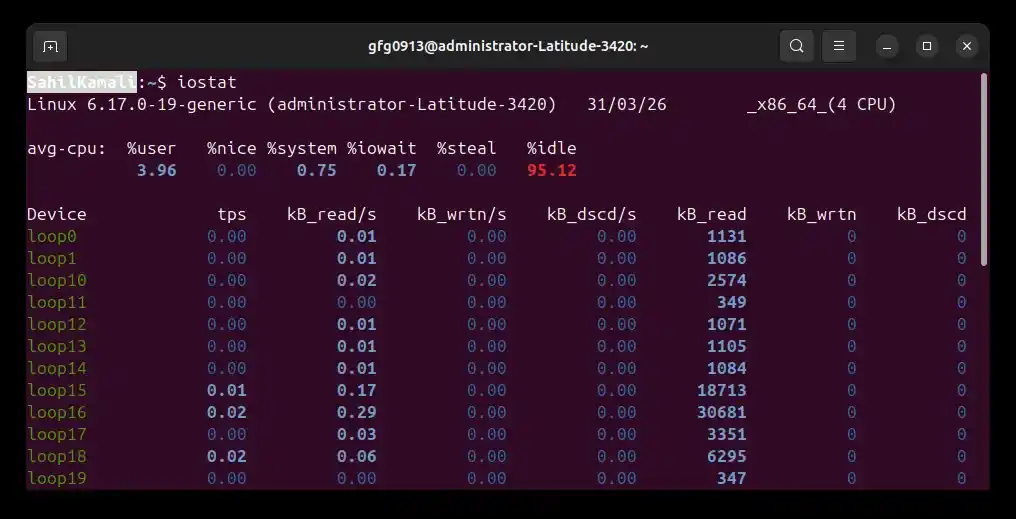
4. iostat command
The iostat (Input/Output Statistics) command is used to monitor CPU utilization and disk I/O performance. It helps identify disk bottlenecks and understand how efficiently the system is handling read/write operations.
- Monitor disk read/write activity.
- Analyze CPU utilization along with I/O.
- Detect disk performance bottlenecks.
- Evaluate system throughput and device load.
Example: Analyze CPU and disk I/O statistics
View CPU and disk I/O statistics. Displays CPU usage and statistics for each disk device, including read/write rates and utilization.
Command:
iostatOutput:
5. netstat command
The netstat (Network Statistics) command is used to monitor network connections, routing tables, interface statistics and port usage. It helps administrators understand network activity and diagnose network-related issues.
- View active network connections.
- Check open and listening ports.
- Monitor network interface statistics.
- Analyze routing tables and network traffic.
Example: List active network connections and ports
Display active network connections and listening services. Shows protocol type, local and remote addresses, connection states and associated processes.
Command:
netstatOutput:
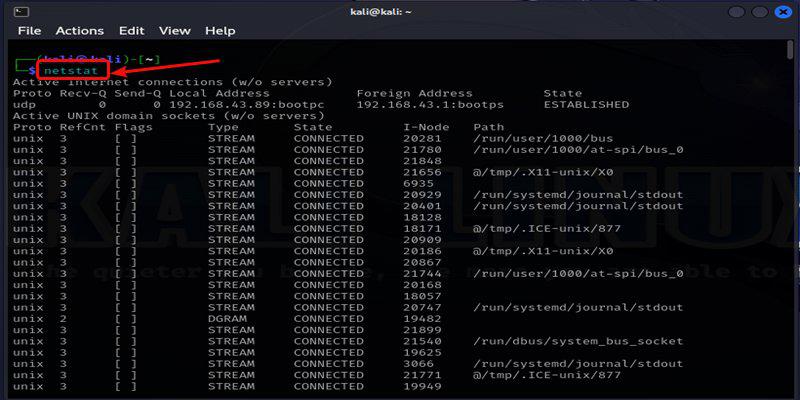
Note: netstat has been deprecated use ss instead
6. iotop command
The iotop command is used to monitor disk I/O usage in real time. It displays the processes that are performing the most read and write operations, helping identify disk-heavy applications that may slow down the system.
- Monitor real-time disk I/O usage by processes.
- Identify processes causing high disk activity.
- Analyze read/write bandwidth usage.
- Troubleshoot disk performance issues.
Example: Track real-time disk I/O by process
View processes consuming disk I/O resources. Requires root privileges to display all process activity. Shows real-time disk read/write usage per process.
Command:
sudo iotopOutput:

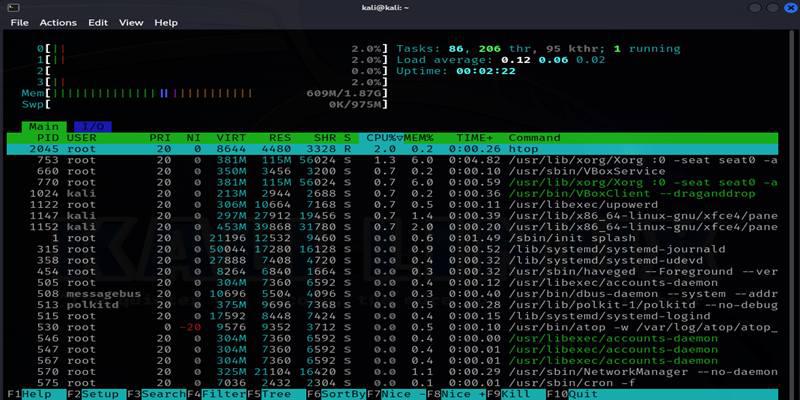
7. htop command
The htop command is an interactive process monitoring tool that provides an enhanced and user-friendly version of the top command. It displays real-time system metrics with better visualization and allows easier interaction with running processes.
- Monitor CPU and memory usage interactively.
- View processes with color-coded output.
- Navigate and scroll through process lists.
- Manage processes (kill, renice) directly from the interface.
- Visualize parent-child process relationships (tree view).
Example: Interactively monitor processes and resources
Monitor system performance with an interactive interface. Opens a dynamic interface showing CPU, memory usage bars and a detailed process list. Requires installation on some systems.
Command:
sudo htopOutput:
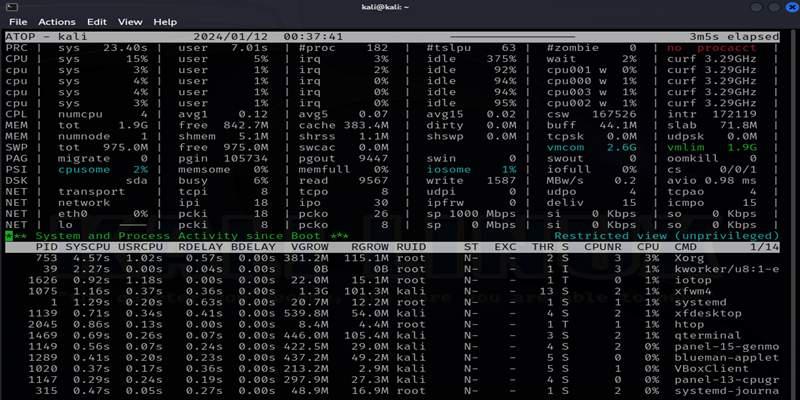
8. atop command
The atop command is an advanced system monitoring tool that provides detailed information about system performance over time. It tracks CPU, memory, disk I/O, network usage and processes and also supports historical logging for later analysis.
- Monitor overall system performance in real time.
- Analyze historical resource usage trends.
- Identify performance spikes and bottlenecks.
- Track CPU, memory, disk and network activity together.
Example: Perform advanced system monitoring
Monitor system performance with detailed metrics and historical tracking. Displays a real-time dashboard of system resources and logs data for later review.
Command:
atopOutput:
9. nmon command
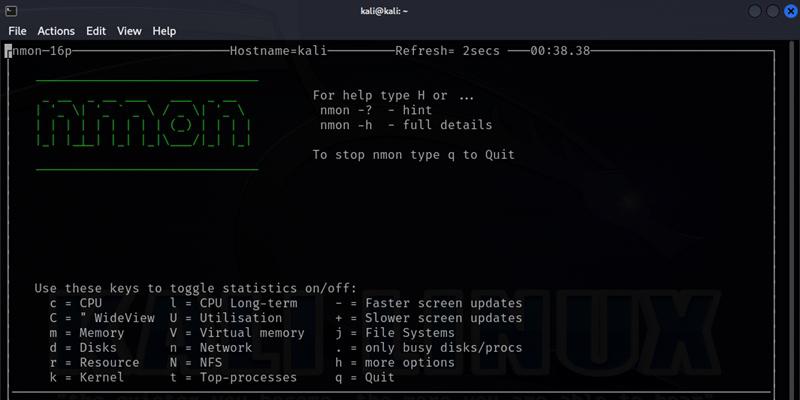
The nmon (Nigel’s Performance Monitor) command is an interactive system monitoring tool used to analyze CPU, memory, disk, network and process performance in real time. It also allows saving performance data for later analysis.
- Monitor system performance with real-time graphs.
- Analyze CPU, memory, disk and network usage.
- Capture performance data for later analysis.
- Identify system bottlenecks visually.
Example: Visualize system performance interactively
Launch an interactive performance monitoring interface. Opens a terminal-based dashboard where different system metrics can be viewed using keyboard shortcuts.
Command:
nmonOutput:
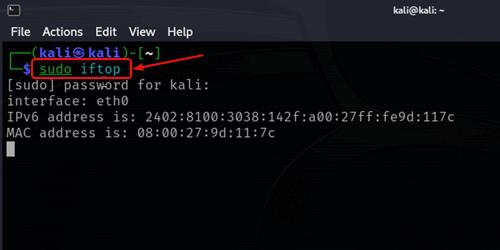
10. iftop command
The iftop command is used to monitor network bandwidth usage in real time. It displays a list of network connections along with the amount of data being transmitted and received, similar to how top shows CPU usage.
- Monitor real-time network bandwidth usage.
- Identify high bandwidth-consuming connections.
- Analyze incoming and outgoing traffic.
- Detect unusual network activity or spikes.
Example: Monitor live network bandwidth usage
Monitor live network traffic across interfaces. Requires root privileges to capture network packets. Automatically detects active interfaces and displays traffic statistics.
Command:
sudo iftopOutput: