Performance testing is a crucial process for software development projects. It ensures that applications perform as required under specific conditions before launching or during development. Apache JMeter is a widely used open-source tool for performance testing, allowing developers and testers to simulate various conditions and evaluate web application performance. This article covers the following areas: what is JMeter, types of JMeter testing, how to use JMeter, advantages and uses of JMeter, and frequently asked questions.
Table of Content
Types of JMeter Performance Testing
JMeter can be used for several types of performance testing:
.webp)
- Load Testing: Tests how the application performs under statistically probable user interactions to identify performance bottlenecks before launch.
- Stress Testing: Evaluates how the application behaves under maximum loads, which may exceed normal operating conditions. This helps identify the application's breaking point and its ability to handle failures.
- Spike Testing: Tests the system with sudden, drastic changes in the number of users to observe how it handles unexpected load surges.
- Soak Testing: A type of load testing where the system is subjected to a specific load for an extended period to identify issues that may occur over time, such as memory leaks.
- Endurance Testing: Tests the application under a challenging environment for an extended period to discover issues that develop over time, such as memory leaks.
- Volume Testing: Assesses the application's performance with large volumes of data to ensure the system can handle substantial data loads effectively.
- Scalability Testing: Evaluates how the system performs as the load increases or decreases, helping to understand its scalability and capacity for handling changes in demand.
How to Use JMeter for Performance Testing?
1. Setting up Apache JMeter
- Download the JMeter zip file from the Apache JMeter website.
- Unzip the file to a suitable directory.
- Navigate to the
bindirectory and execute thejmeter.batfile (for Windows) orjmeterscript (for Unix/Linux) to start JMeter.
.jpeg)
It may take some time, and then the window of JMeter in the screen will appear.
Here, the test plan is renamed as performance testing, Although the test planning for the performance testing was good, it lacked proper documentation.
2. Adding a Thread Group
- When the ‘Performance Testing’ window is opened, right-click on the window.
- Press Ctrl+N for ‘Add’, go to Threads (Users), then choose ‘Thread Group’.
.jpg)
Here it was made clear that the thread group means users, that is, the number of users.
It has several features; the following are some of the options it has:
- Action to be taken after there is an error: It can be chosen the way you wish it to be.
- After that, there is a “number of threads” option in which users can define the number of users for them.
- Then, there is a “ramp-up period in seconds,” which defines the time difference between the hits of the users.
- To help with this, there is a trade-off termed a “loop count,” whereby one can opt for the number of times the test will be conducted for the number of users. You can also decide the given test to run for a number of times till it is infinity.
- For your information, there is also a scheduler here to set the start time, and it is equally important to set the time when the test will be completed.
- For now, let the number of threads be 2. After which, the loop count must be equal to 100
3. Adding an HTTP Request
- After right-clicking on the thread group, go for the add option and move down to the sampler option.
- The next one is choosing the HTTP request in the menu that appears.
If the configured DNS information is wrong, it will show the wrong server name or IP number, or you can see a space for that to input the correct information
This demo will use Sampliner's official website which is ‘’ Simplilearn : Online Bootcamp for IT Courses ’’located here.
- Go to Sampliner's website
- right click on the url in the options bar and select copy
- Type command + tab to come back to the JMeter window
- Copy and paste the URL in the Server Name box
.jpg)
The forward slash is used since the aim is to access the route page.
- Here, this demo will rename this HTTP request as Simple.
Now, to get results, let's add listeners.
4. Adding Listeners
There are the following three different listeners that can be used here so that you can get an idea about the representation that the JMeter provides.
- They right-click on the thread group.
- To perform this task, one needs to open Add, choose the Listener option, and then select the view Results in Tree option.
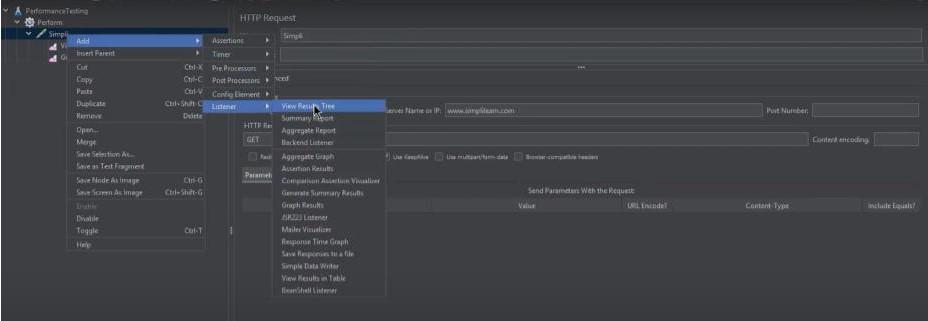
- As before, open the listener option and right-click on it, this time selecting graph results from the options.
- Similarly, for the third listener, right click again, and the option View Results in Table has to be selected.
Now, it is time to test it. The corresponding procedure is:
5. Running the Test
Save this JMeter test
.jpg)
Click the green button and actually run the test
6. View Results Tree
Now, should you go to the “View Results Tree,” you can observe the test running. Same with graph results. You can then also capture the duration of the test that is currently running or has been running until completion.
.jpg)
Because this demo has two threads and the loop count is 100, the test will take a certain amount of time. Thus, when the user checks on “view results in table," he or she is able to view different performance testing metrics on the screen. The visible names of every single thread include the thread name, the label, sample time per second, bytes, sort bytes, as well as latency.
.jpg)
7. Graph Result
Then in the tree option several performance testing metrics are seen just by clicking on any of the tests. Now it is visible on the pictures in the graph results regarding the tests happening in relation to IP address, thread, and loop.
.jpg)
Therefore, in simple terms, what exactly JMeter is capable of doing or aimed to do is that it forms a request and forwards it to the server. Once it receives the server’s response, it gathers them and can display that detail in the form of a chart or a graph. Then, it parses the server’s response, and last of all, it generates tests results in one or multiple formats such as TXT, XML, or JSON, so that the tester can analyze the data.
Benefits of JMeter for Performance Testing
JMeter offers several benefits for performance testing:
- Open Source: JMeter is free to use and can be downloaded without any licensing fees.
- Platform Independent: Being written in Java, JMeter can run on any operating system with a Java Runtime Environment (JRE).
- User-Friendly GUI: JMeter’s graphical interface simplifies the creation and configuration of test plans.
- Extensible: JMeter supports a wide range of plugins to enhance functionality and integration with other tools.
- Comprehensive Reporting: JMeter offers detailed reports and visualizations to help analyze performance metrics effectively.
- Scalability: JMeter can simulate a large number of users and test applications of any size.
Conclusion
Apache JMeter is a powerful tool for performance testing, offering a range of testing types and benefits. Its user-friendly interface, extensive reporting capabilities, and flexibility make it a preferred choice for many testers and developers. By following the guidelines provided, users can effectively utilize JMeter to ensure their applications meet performance benchmarks.
