A Bump Chart is used to visualize how categories rank against each other over time. Instead of focusing on absolute values, it highlights relative position changes making it easy to track performance trends across different time periods. They are useful for:
- Comparing rankings of categories over time
- Identifying rising and declining trends
- Analyzing performance consistency
- Presenting time-based comparisons clearly
Creating Bump Chart in Tableau
Note: For this article, a sample dataset "vgsales.csv" is used, to download click here.
Step 1: Create the Base Line Chart
Drag the Year field to the Columns shelf and drag Global_Sales to the Rows shelf.
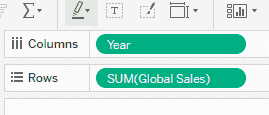
This creates a basic line chart showing global sales trends over the years.
Step 2: Add Genre and Apply Filters
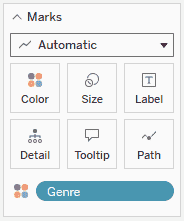
1. Drag the Genre field to Colour in the Marks card. This creates separate lines for each genre.
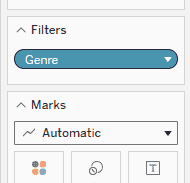
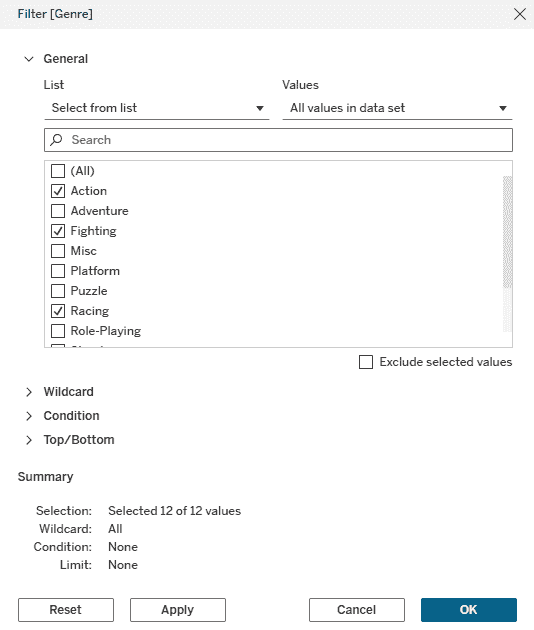
2. Drag Genre to the Filters shelf and select a few genres you want to compare like Action, Fighting, Racing, Sports, etc and click OK.
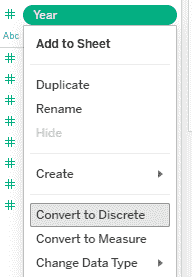
3. In the Data pane, right-click on Year field and click convert to discrete
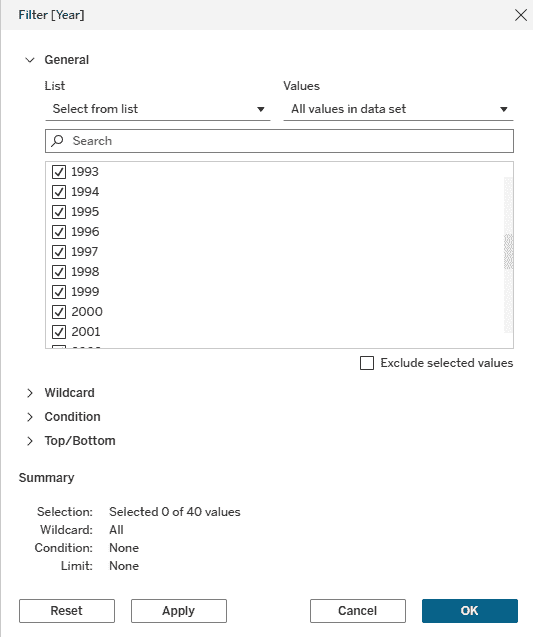
4. Drag Year to the Filters shelf an select the year range from 1993 to 2004 and click OK.
Step 3: Convert Sales into Rank (Bump Effect)
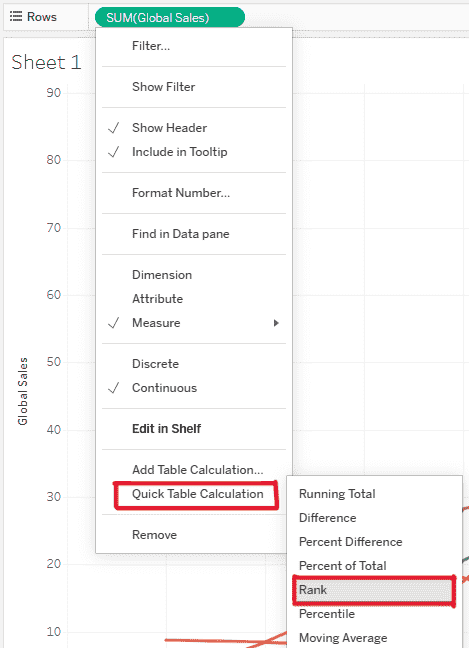
1. Right-click SUM(Global_Sales) on the Rows shelf and select Quick Table Calculation -> Rank.
2. Right-click SUM(Global_Sales) again and select Compute Using -> Genre.
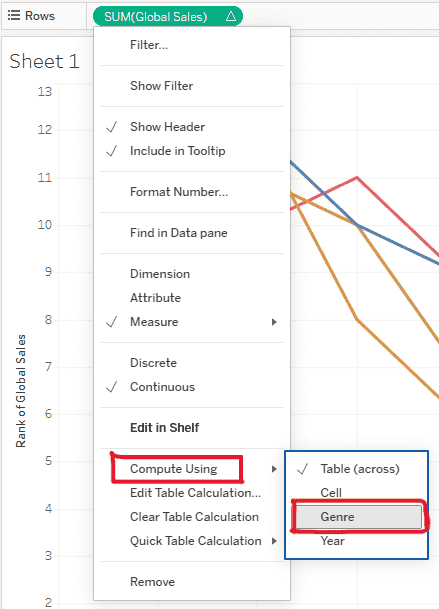
This converts the sales values into rankings for each year, creating the core bump chart behavior.
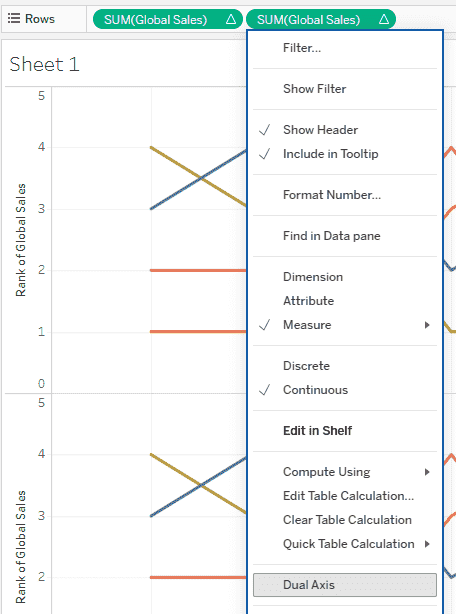
Step 4: Add Circles Using Dual Axis
1. In Rows shelf, click Ctrl and drag and put Global_Sales right next to it and right-click the second SUM(Global_Sales) pill and select Dual Axis.
2. In the Marks card, select the second Global_Sales Marks card and change the mark type to Circle and increase the Size.
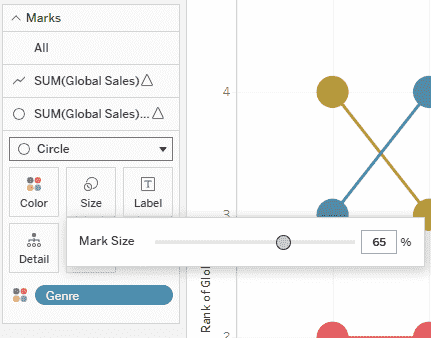
This adds circular markers on the ranked lines, improving readability and visual appeal.
Final Result
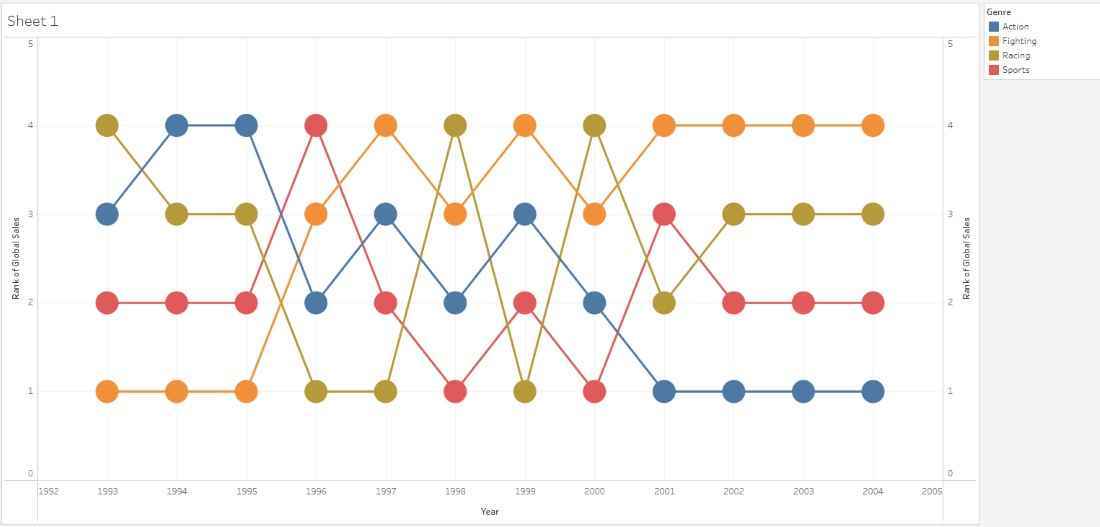
The final visualization is a Bump Chart that clearly shows how different game genres move up or down in rank across years based on global sales.
