Clustering in Tableau is an advanced analytics feature that automatically groups similar data points based on selected measures. It helps identify hidden patterns, similarities and natural groupings within data without writing any complex code. Clusters are useful for:
- Discovering patterns in large datasets
- Grouping similar records automatically
- Segmenting data for better analysis
- Performing exploratory data analysis visually
Creating Cluster in Tableau
Note: For this article, a sample dataset "auto_mpg.csv" is used, to download click here.
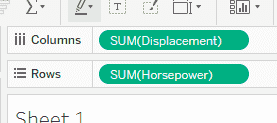
Step 1: Create the Base Scatter Plot
From the Data pane, drag Horsepower to the Rows shelf and drag Displacement to the Columns shelf.
Step 2: Turn Off Aggregation
From the top menu, click Analysis and uncheck Aggregate Measures.
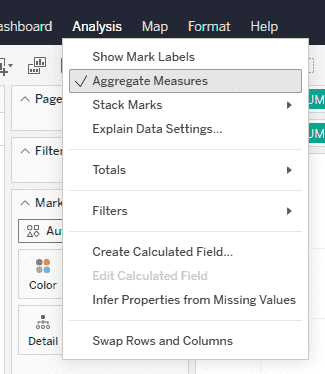
Disabling aggregation ensures that each data point is shown individually instead of being summarized.
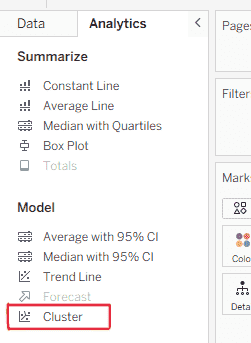
Step 3: Apply Clustering
1. On the left sidebar, click the Analytics tab (next to Data) and under the Model section, double-click and select Cluster.
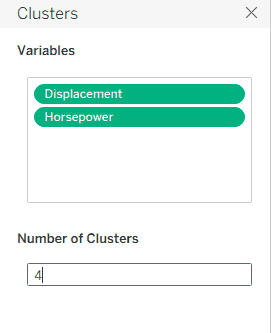
2. A Cluster dialog box will appear automatically, set the Number of Clusters to 3.
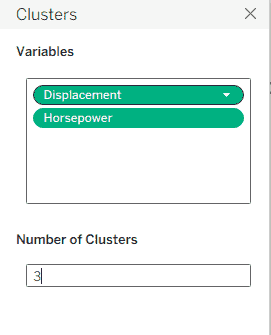
Tableau now automatically groups the data points into three clusters using built-in statistical algorithms.
Step 4: Modify Number of Clusters (Optional)
1. In the Marks card, click the Cluster pill and select Edit Clusters.
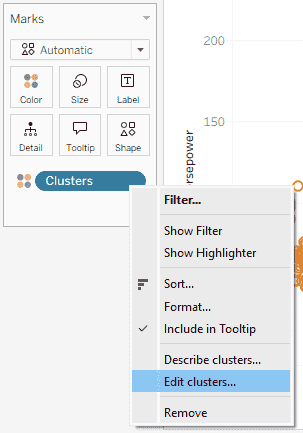
2. Change the number of clusters (for example, from 3 to 4) if required.
This allows experimentation with different cluster groupings to better understand the data.
Step 5: Add More Detail to Clusters
From the Data pane, drag MPG to Detail in the Marks card.
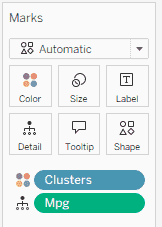
Now, when hovering over any data point, the MPG value appears in the tooltip, providing more insight into each cluster.
Final Output
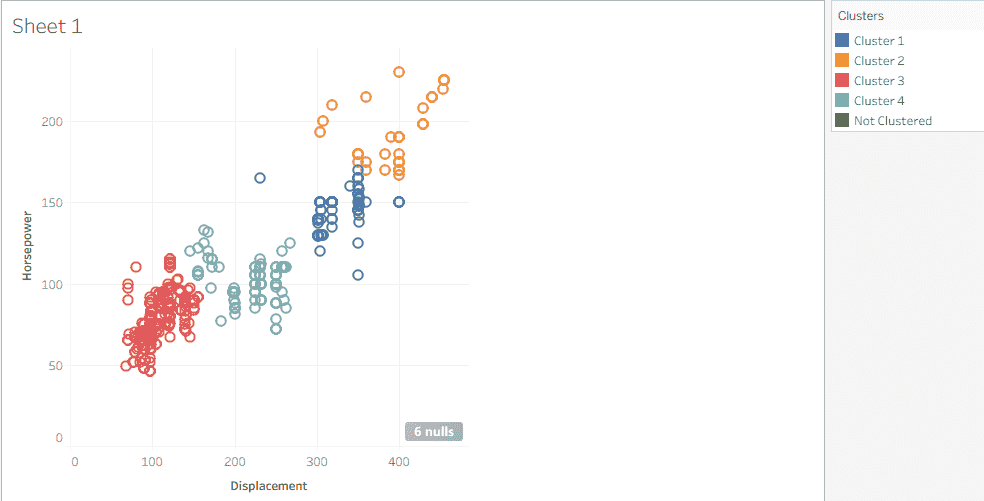
The final visualization displays a clustered scatter plot where data points are grouped based on similarities in horsepower and displacement. Each cluster is visually distinguished by color, making patterns and relationships easier to identify.
