A Donut Chart is a variation of a pie chart with a hollow center. It displays data as proportional slices of a circle while leaving space in the middle, which can be used to show totals or key metrics. Donut charts are commonly used to represent percentages and parts of a whole in a visually appealing way. They are useful for:
- Showing the proportion of categories within a whole
- Displaying total values or KPIs at the center
- Making comparisons easier with a cleaner visual
- Enhancing dashboards with compact and modern visuals
Creating Basic Donut Chart
Tableau does not provide a built-in donut chart option, but it can be created by combining a pie chart with a dual axis. Below are the steps to create a donut chart in Tableau:
Note: For this article, a sample dataset "vgsales.csv", to download click here.
Step 1: Create the Base Donut Structure
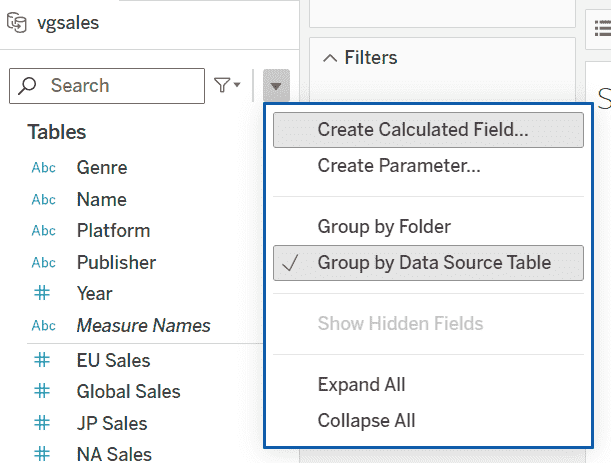
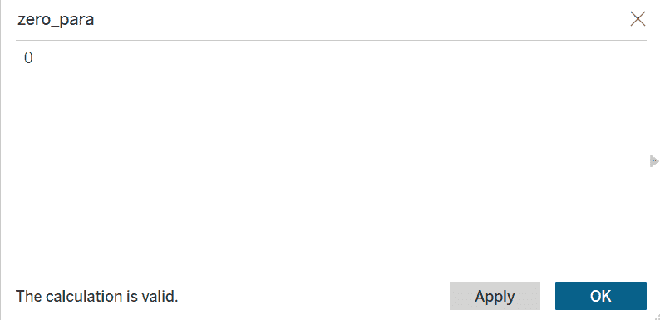
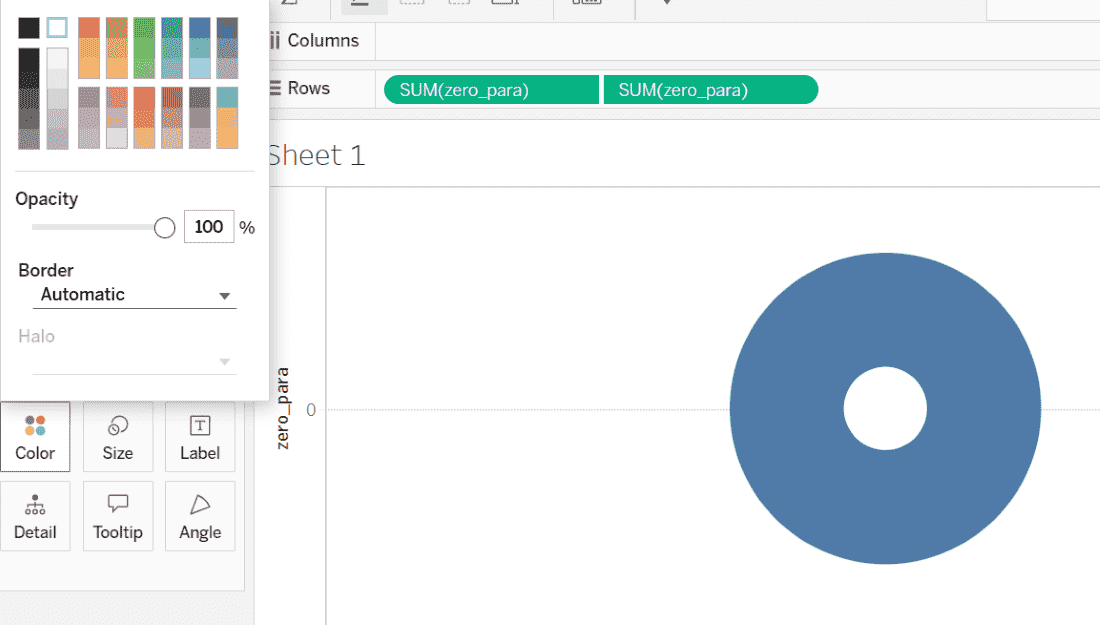
1. In the Data pane, right-click and select Create Calculated Field and name the field zero_para and set its value to 0.
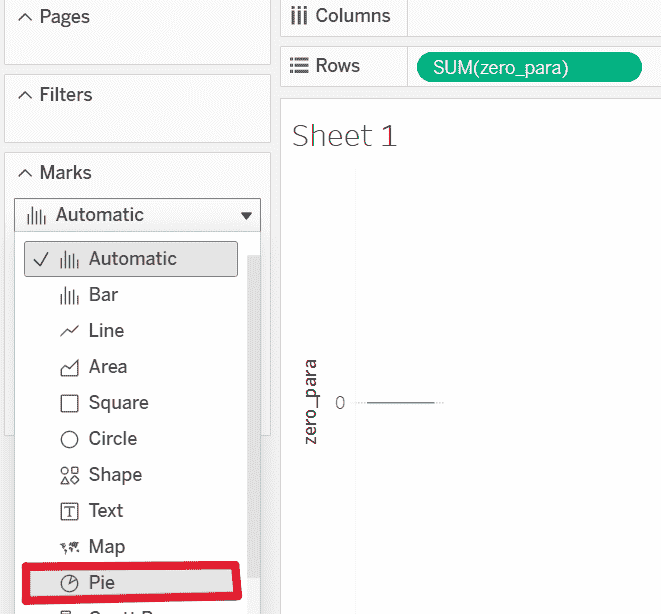
2. Drag the zero_para field to the Rows shelf. In the Marks card, open the drop-down and change the mark type to Pie.
3. Click Fit (top toolbar) and select Entire View so the pie chart fills the worksheet area.

Step 2: Create the Donut Hole and Center Label
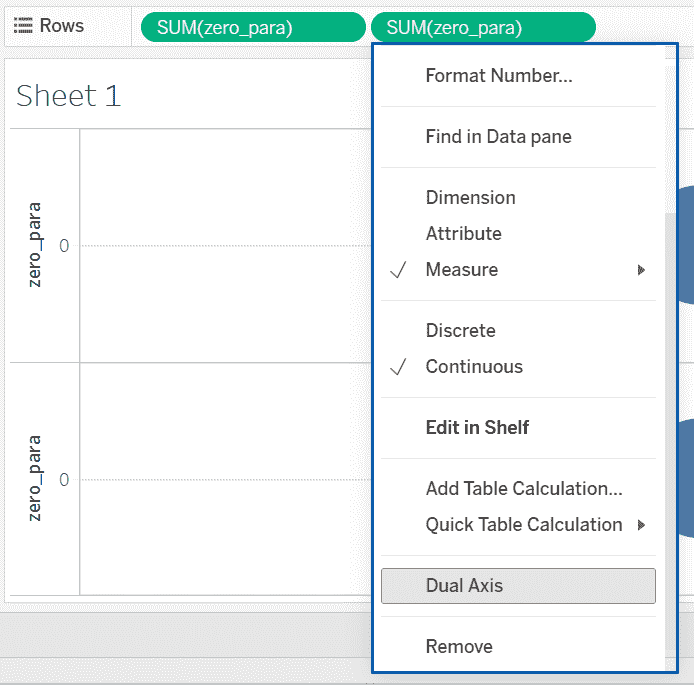
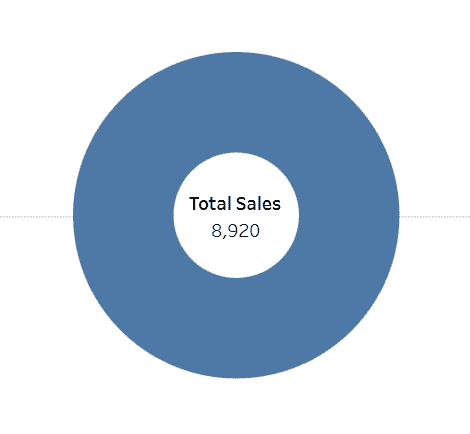
1. Drag the zero_para field again to the Rows shelf. Click the second zero_para pill on Rows and select Dual Axis. Two pie charts will now overlap.
2. From the Marks card, select the second Pie (the lower Marks card). Reduce the Size of the second pie using the Size slider. Click Color and change the color to White to create the donut hole effect.
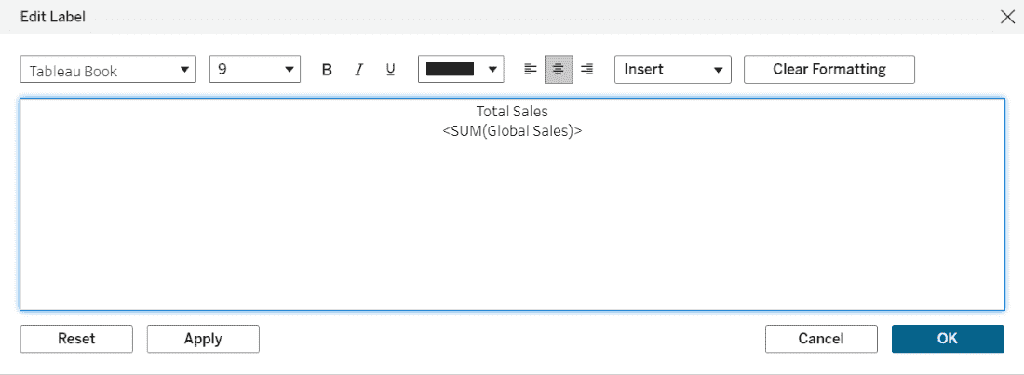
3. Drag Global_Sales to Label on the second Marks card. Click Label -> Edit Label and update the text to display something like: Total Sales <SUM(Global_Sales)>
Step 3: Add Data, Colors and Labels to the Donut
1. Select the first Marks card (the outer pie). Drag Genre to Color to differentiate slices and drag Global_Sales to Angle to control slice size.
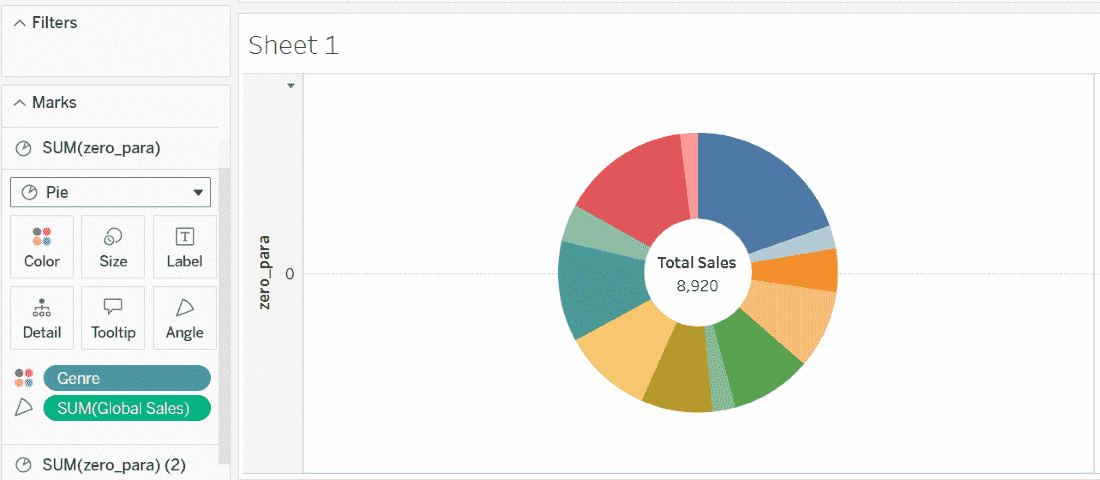
2. Drag Global_Sales to Label to display values on slices and drag Genre to Label so each slice shows its category name.
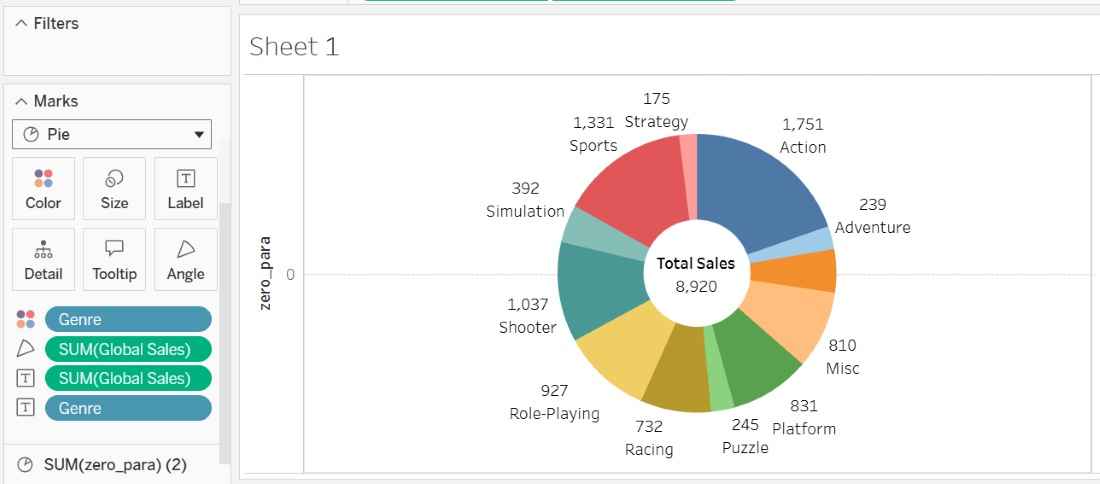
Adjust Label formatting and colors if needed for better readability.
