A Dumbbell Chart is used to compare two or more values across categories, highlighting the difference between them using connected points. It is especially useful for showing change over time, comparisons between years or before-and-after analysis in a clean and visual manner. They are useful for:
- Comparing values across two specific time periods
- Highlighting increases or decreases clearly
- Reducing clutter compared to grouped bar charts
- Making category-wise comparisons easy to interpret
Creating a Dumbbell Chart in Tableau
Tableau does not provide a built-in dumbbell chart, but it can be created by combining circle marks, line marks and a dual axis.
Note: For this article, a sample dataset "vgsales.csv" is used, to download click here.
Step 1: Create the Base Structure
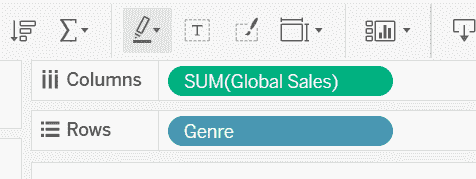
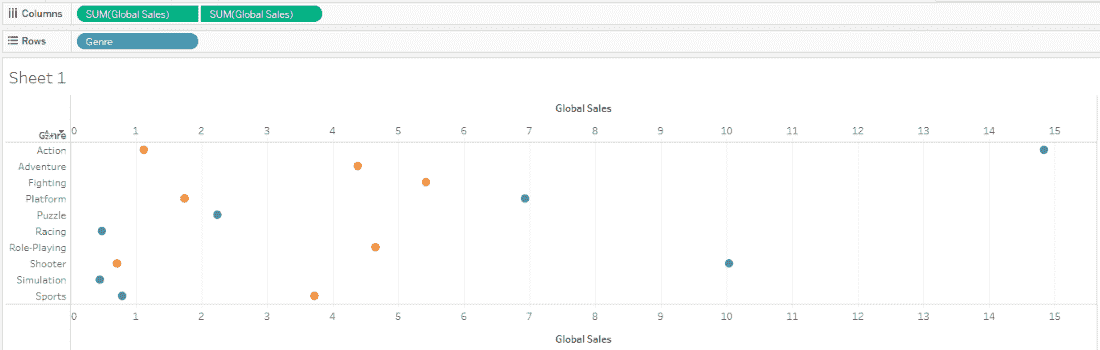
1. From the Data pane, drag Global_Sales to the Columns shelf and drag Genre to the Rows shelf.
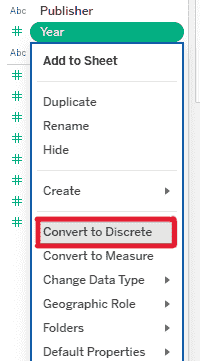
2. In the Data pane, right-click the Year field and select Convert to Discrete.
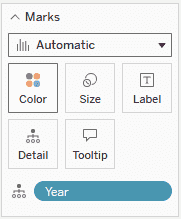
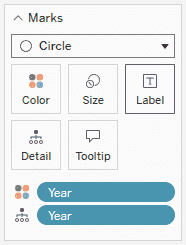
3. Drag the Year field to the Marks card -> Detail.
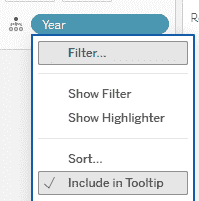
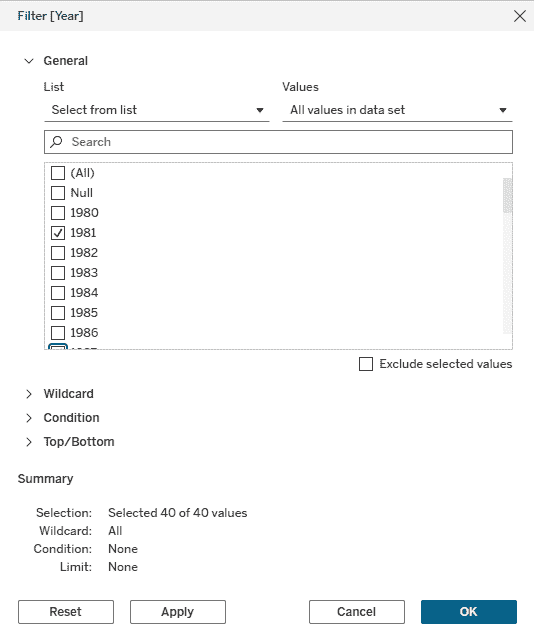
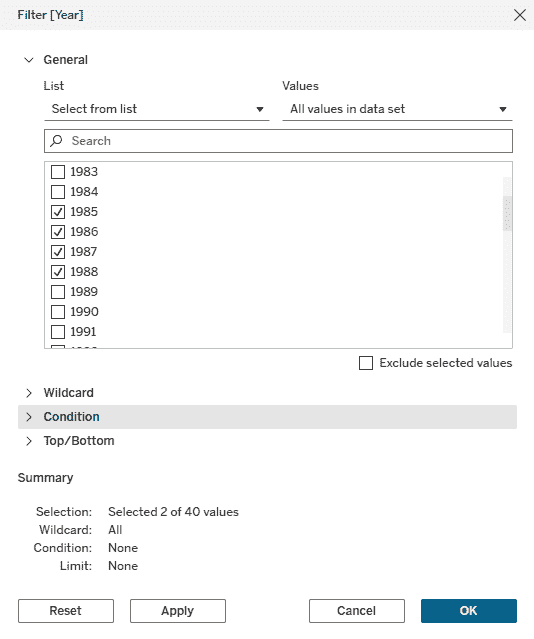
4. Right-click the Year field on the Marks card, choose Filter, select only 1981 and 1987, then click OK.
Step 2: Create the Dumbbell Points and Connecting Line
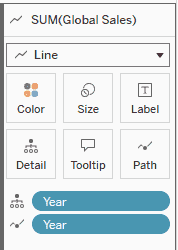
1. In the Marks card, change the mark type to Circle and drag Year to Color to differentiate the points by year.
2. Drag Global_Sales again to the Columns shelf and right-click the second SUM(Global_Sales) pill and select Dual Axis.
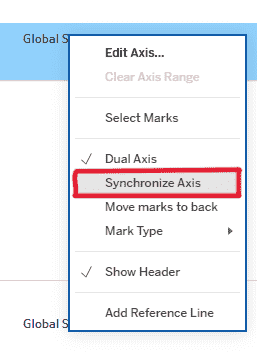
3. Right-click one of the Global_Sales axes and select Synchronize Axis.
4. In the first Global_Sales Marks card, change the mark type to Line and drag Year from Color to Path to connect the points.
Step 3: Customize Years and Colors
1. To show more comparisons, edit the Year filter and add additional years such as 1982, 1985, 1986 and 1988.
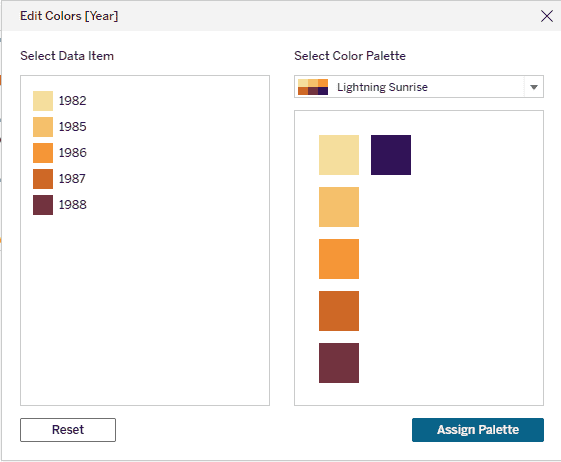
2. Select the second Global_Sales Marks card (Circle) and click Color and choose a suitable color palette for better visual distinction.
Final Output
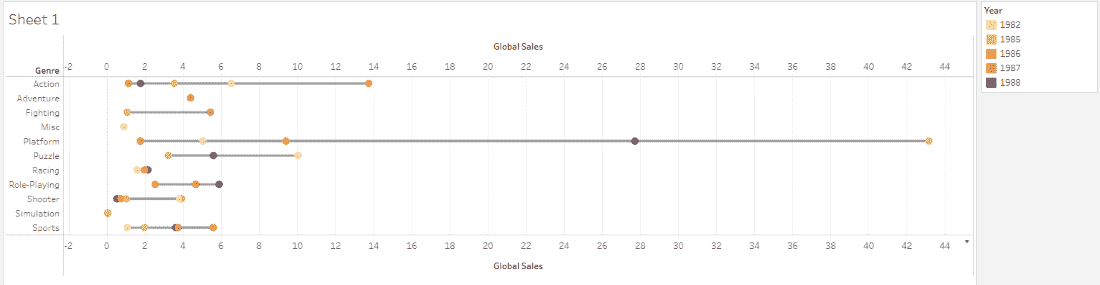
The final Dumbbell Chart displays Global Sales by Genre, comparing sales across selected years. Each genre has two or more points connected by a line making it easy to identify trends, increases or decreases over time.
