The Marks Card in Tableau controls how data is visually represented in a chart. It allows us to customise the appearance and behaviour of marks (data points) using different properties. Using the Marks Card, we can:
- Change colours and shapes to differentiate categories
- Adjust the size to represent the magnitude of the data
- Add labels, details and tooltips for better interactivity
Creating a Scatter Plot
To understand the Marks Card better, we first need to plot a simple graph and then explain each Marks Card option one by one using the same visualization.
Note: For this article, a sample dataset "IRIS.csv" is used, to download click here.
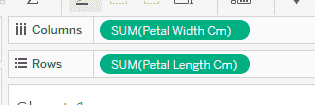
Step 1: Drag Petal Length (cm) to the Rows shelf and drag Petal Width (cm) to the Columns shelf.
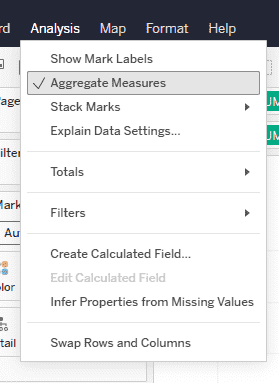
Step 2: Then, from the top menu, go to Analysis and uncheck Aggregate Measures.
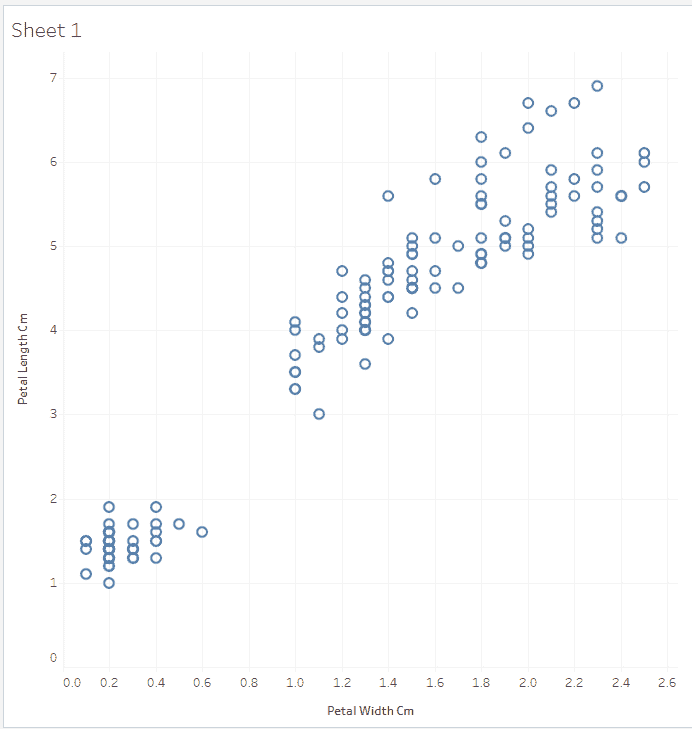
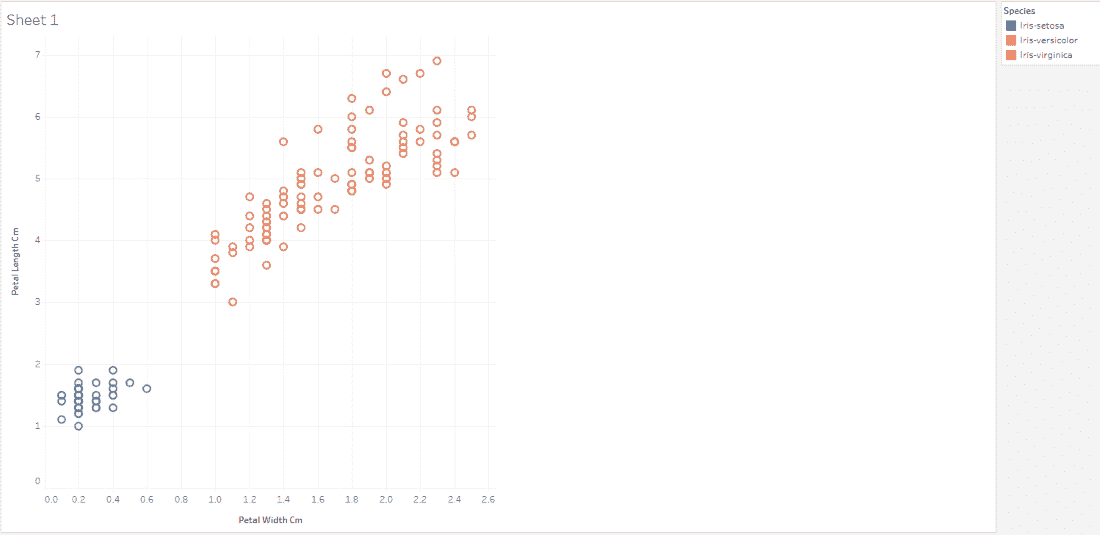
This creates a scatter plot where each point represents an individual flower as shown below:
Color Card
The Color option is used to differentiate data points visually. It helps in group comparison and visual separation.
1. In Tableau, drag Species to Color
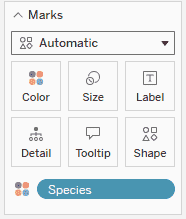
2. Now the scatter plot points are colored differently for each species, making it easy to compare how different flower species are distributed.
Size Card
The Size option controls how big or small each mark appears. It is useful to show magnitude or intensity of a measure.
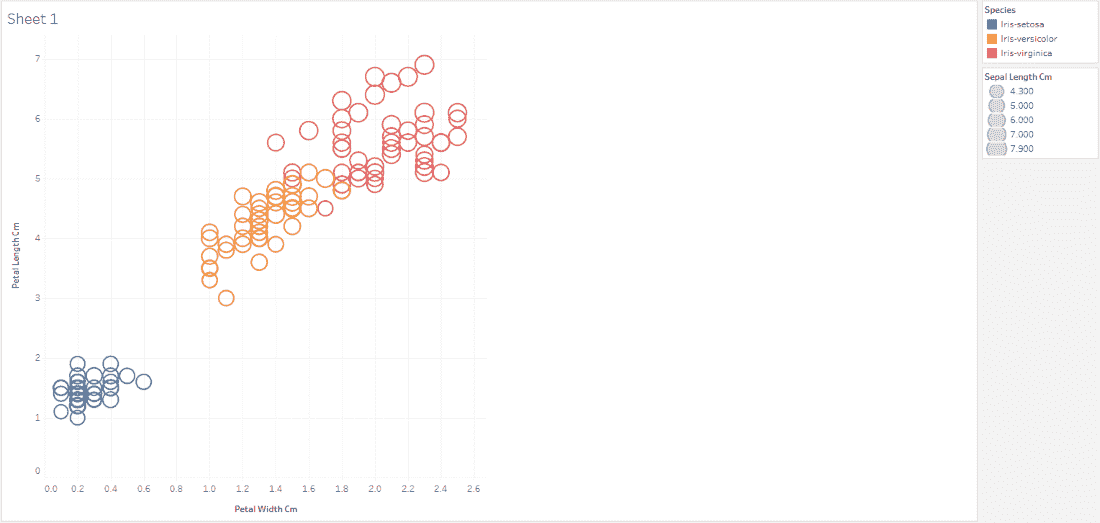
1. In tableau, drag Sepal Length (cm) to Size
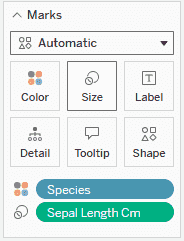
2. Now points with larger sepal length appear bigger and smaller values appear as smaller points.
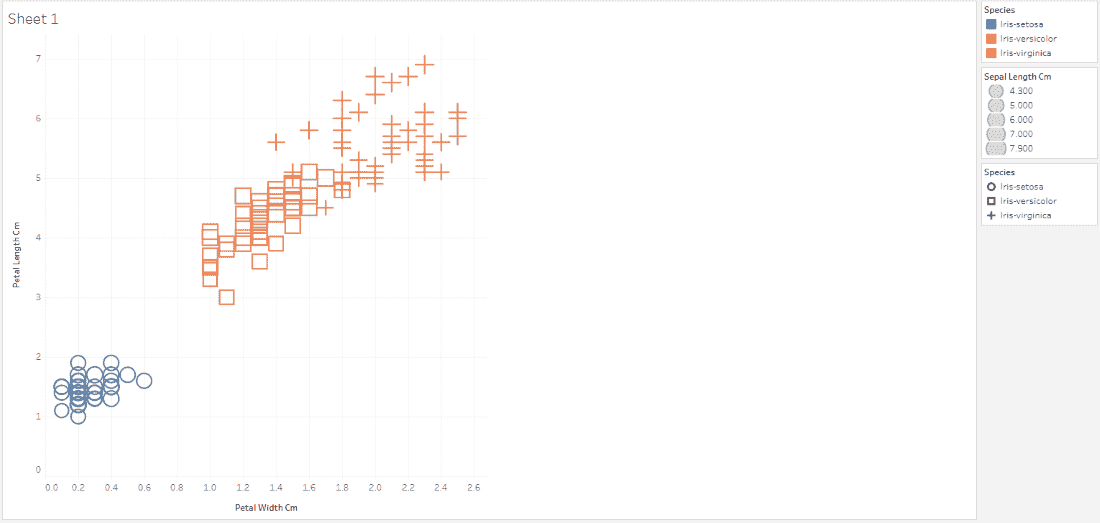
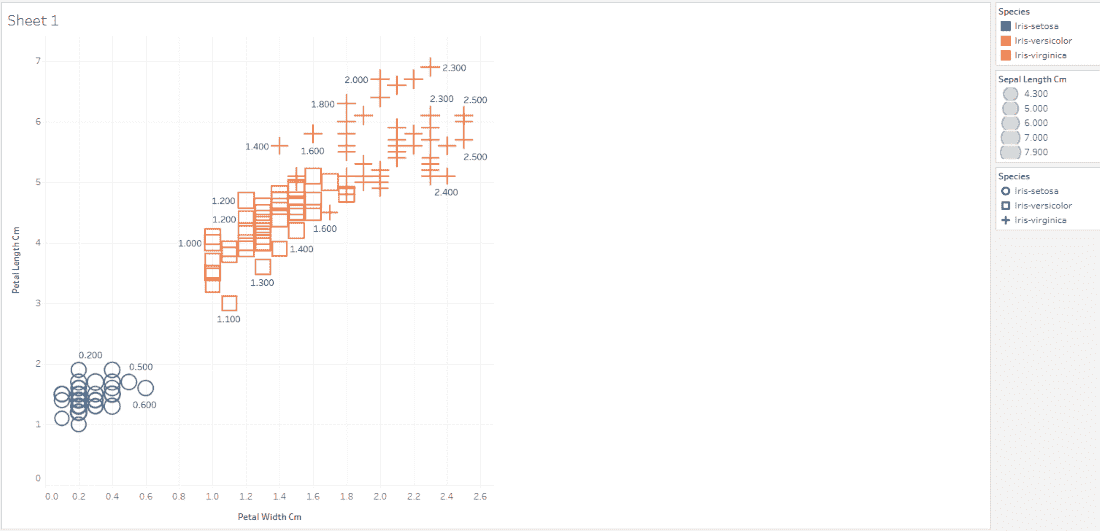
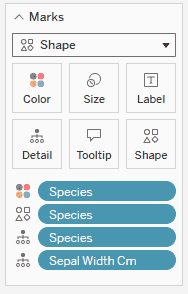
Shape Card
The Shape option changes the symbol used for each mark. It is helpful when color is limited for accessibility.
1. In tableau, change the mark type to Shape and drag Species to Shape
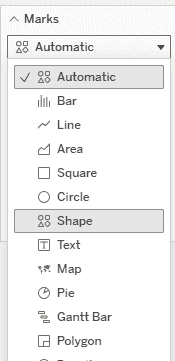
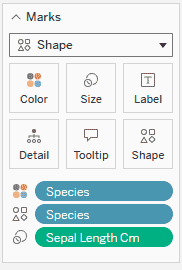
2. Now each species is represented using a different symbol, making the scatter plot distinguishable even without color.
Label Card
The Label option displays text directly on the marks. It is useful when exact values or categories need to be visible.
1. In tableau, drag Petal Width (cm) to Label
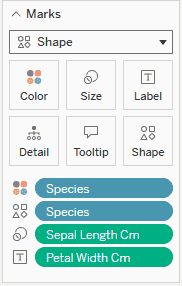
2. Now labels appear on the scatter plot points, showing values directly on the chart.
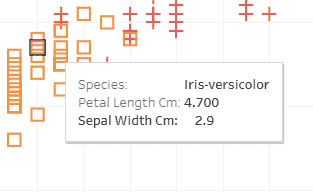
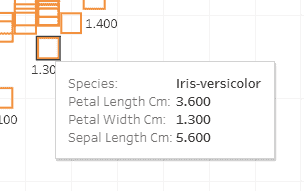
Tooltip Card
The Tooltip controls what information appears when hovering over a mark. It provides interactive, detailed insights on hover.
1. In tableau, hover over a point to see the default tooltip
2. Edit Tooltip to include fields like Species, Sepal Width and Sepal Length
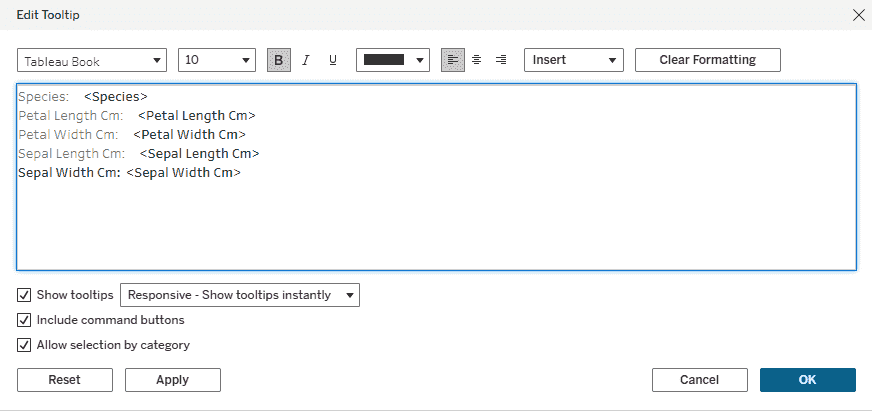
3. Now hovering over a point gives rich contextual information without cluttering the chart.
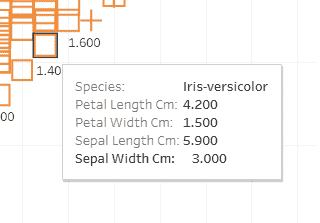
Detail Card
The Detail option is used to add extra information to each mark without changing its appearance.
1. Drag Species and Sepal Width (cm) to Detail
2. Now, when you hover over any point in the scatter plot, you can see: Species and Sepal Width along with Petal Length.