Showing posts with label Testing. Show all posts

Monday, June 17, 2013

Fix for View Criteria Search Results with DB Pooling Enabled

In order to minimize DB connections usage and optimize ADF runtime performance, I often prefer to enable DB pooling and keep data between requests in memory (jbo.doconnectionpooling = true and jbo.txn.disconnect_level = 1). Read more in this post - Stress Testing Oracle ADF BC Applications - Do Connection Pooling and TXN Disconnect Level. There is one bug related to the View Criteria search results - rows are not always displayed correctly. I will describe the fix.

Sample application - SearchRefreshDBPoolApp.zip is enabled with DB pooling:


Disconnect level is set to 1 to keep data between requests in memory:


Do a search for the last employee in the rowset - Gietz:


As soon as results list will be filtered:


Clear up search criteria for the LastName and search again with blank criteria to get all rows:


Not all rows are retrieved to the UI, you can try to scroll up and down - still results list is incomplete. Only if you press Search button second time - then results list will be refreshed and bring correct results.

The fix is to set ContentDelivery=Immediate for the table component:


After repeating same test scenario, results list will be complete from the first time:

Wednesday, November 16, 2011

Stress Testing Oracle ADF BC Applications - Do Connection Pooling and TXN Disconnect Level

Today I will describe how jbo.doconnectionpooling = true and jbo.txn.disconnect_level = 1 properties affect ADF application performance. Read more about these properties - ADF BC Tuning with Do Connection Pooling and TXN Disconnect Level. Previous posts related to ADF BC application stress testing - Stress Testing Oracle ADF BC Applications - Internal Connections.

We will see that with jbo.doconnectionpooling = true and jbo.txn.disconnect_level = 1, average request processing time is faster. Performance boost is achieved, because passivation/activation circle happens in memory (data remains in memory) - data is not being stored into PS_TXN table, this allows to save execution time. After each request, we are releasing DB connection, this allows to save server resources as well. However, please keep in mind - this tuning approach is suitable mostly for such use cases, where database connection doesn't keep temporary data in database (for example - post changes or long running locks). Because of frequent database connection switch, you may loose such data.

Download sample test case - stresstest_v3.zip.

Stress test is performed with 80 concurrent users, 16000 transactions in 10 minutes (see previous posts for more details on JMeter script).

jbo.doconnectionpooling = true


jbo.txn.disconnect_level = 1


Average request processing time is quite interesting - it is a bit slow for initial requests, but improves with time:


If we compare the same type of graph, when jbo.doconnectionpooling = false and jbo.txn.disconnect_level = 0, number of passivations/activations is reported to be the same. Average request processing time is slightly longer:


Average request processing time with jbo.doconnectionpooling = true and jbo.txn.disconnect_level = 1 is 43.12 (ms):


Average request processing time with jbo.doconnectionpooling = false and jbo.txn.disconnect_level = 0 is 75.23 (ms):


Database connection usage with jbo.doconnectionpooling = true and jbo.txn.disconnect_level = 1 is reduced significantly. There should not be PS_TXN passivation/activation happening, but it still reports some internal connections consumed by AM:


As expected - much more database connections are reserved with default jbo.doconnectionpooling = false and jbo.txn.disconnect_level = 0:


Tuesday, November 8, 2011

Stress Testing Oracle ADF BC Applications - Internal Connections

We had productive discussion with Chris Muir for my previous post - Stress Testing Oracle ADF BC Applications - Passivation and Activation (see post comments). Two questions were discussed:

1. Importance of AM Maximum Pool Size
2. Higher than expected DB connection usage during stress test

I did additional stress tests (download JMeter config file - AMTest.jmx) and was able to get more information from test results - I would like to share with you. Download test case application updated for this post - stresstest_v2.zip.

For stress test scenario and number of concurrent users, please refer to blog post mentioned above. I'm using the same AM pool tuning settings for today post:


First lets answer:

- Higher than expected DB connection usage during stress test

As we saw in the last post, when stress test with 80 concurrent users was applied (look into 3rd Pessimistic scenario), application was using more than 40 DB connections for 40 active AM instances:


We were thinking, why such behavior is happening. Finally we realized, this happens because of additional internal AM connections to support passivation/activation behavior. Why additional connections are not visible on normal load? It looks like when passivation/activation action happens really fast, additional internal connections are not reported. But on high load, when WebLogic is not able to process passivation/activation fast enough - usage of internal AM connections becomes visible.

In order to prove that, we have created second data source (jdbc/HrInternalDS) on WebLogic and declared it to be used for internal AM connection - jbo.server.internal_connection property:


After performing stress test with new data source configuration, we can confirm that main application data source reflects number of active AM instances, while dedicated data source for AM internal operations reports additional connections:


This means its a good practice to declare separate dedicated data source for AM internal operations, if you want to maintain predictable number of database connections for application data source.

- Importance of AM Maximum Pool Size

This time I was repeating stress test multiple times, after 4 stress test (refer to Pessimistic scenario) iterations WebLogic server became slower - request processing for 5th iteration slightly reduced.

We can notice that from number of completed passivation/activation operations per minute - reduced to 1000 (it was 1500 before). This means passivation/activation circle started to happen slower. As result, AM pool is not able anymore to serve all 80 concurrent users with 20 AM instances (as per Referenced Pool Size). In this situation, number of active AM instances starts to grow, while finally its reaching Maximum Pool Size (30):


If there are even more online concurrent users coming, they will give NullPointer exceptions - because application physically unable to handle so many passivation/activation circles. If you will experience such situation, this means you need to increase Maximum Pool Size, as well as adjust Referenced Pool Size.

If we continue stress test and move to second AM, because of high load on the server - second AM performs even less passivation/activation circles (just around 600, before it was 1500) for 80 concurrent users with Maximum Pool Size = 30:


Naturally in this situation, second AM will be able to serve even less concurrent users on high load.

Sunday, November 6, 2011

Stress Testing Oracle ADF BC Applications - Passivation and Activation

When we are talking with customers about Oracle ADF performance, very often we can hear such question - "Hey, ADF works well when there are few concurrent users, how it behaves when there is more serious load?". In order to answer this question I will publish series of posts, where we will study different parameters for AM pool tuning and test AM pool configuration under stress loads. Today we will see how stable is AM pool passivation/activation mechanism.

Stress tests are implemented with JMeter. Check Chris Muir blog about JMeter configuration for ADF 11g. I'm using JMeter configuration file from Chris blog, however original file is updated with internal loops to repeat session requests. JMeter allows to run stress test with multiple parallel users, each users starts its own HTTP session. It is not enough for stress test, additionally I would like to repeat user action within the same HTTP session - its why internal loops are needed, these loops allow to iterate through the same requests multiple times.

We will run 3 test scenarios (hardware: 4 virtual processors, 4 GB RAM):

1. Optimistic (15 concurrent users, 300 transactions in 10 minutes)
2. Average (25 concurrent users, 5000 transactions in 10 minutes)
3. Pessimistic (80 concurrent users, 16000 transactions in 10 minutes)

Each scenario consists of these steps:

1. Session initialization
2. Open Departments page (local AM)
3. Perform data change and Commit operation. Repeat 100 times per user, with 3 seconds wait time
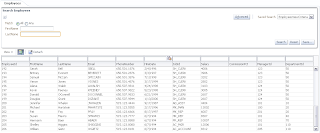
4. Open Employees page (region imported from ADF library)
5. Perform data change and Commit operation. Repeat 100 times per user, with 3 seconds wait time

JMeter configuration file - internal loop to repeat session requests:


Wait time in the loop - 3 seconds:


Download sample application for stress test - stresstest_v1.zip. Sample contains two applications - main and application library. Both applications implement two AM modules, pool settings for both AM's are configured to the same values. There are two pages inside main application, first page brings data from local AM, second from imported region and related AM:


Second page integrates ADF region from ADF library:


Stress test is designed to run such scenarion, where user clicks on Submit button from ADF UI, this button calls custom method from AM interface. Custom AM method is accessing VO row, by randomized value in range based on VO rowset size. Numeric attribute value is changed (incremented by 1) for every accessed row, transaction is committed or reverted back, depending on concurrent modification. Additionally we have one transient attribute, it is set to be passivated:


All 3 stress test scenarios (Optimistic, Average and Pessimistic) are executed with the same AM pool configuration (for both AM's) - based on rough estimate of approximately 20 concurrent users in the system:


- Initial Pool Size = 22 (number of AM instances created on first ever access, recommended to be 10% more than estimated number of concurrent users)
- Maximum Pool Size = 30 (number of maximum AM instances pool can create, recommended to be 20%-30% more than initial pool size)
- Referenced Pool Size = 20 (number of active AM instances, recommended to be the same as estimated number of concurrent users - to avoid frequent passivation/activation)
- Minimum Available Size = 0 (when set to 0, allows to release all AM instances after idle timeout, this helps to release reserved database connections as well. Is set to 0 for tests in stress environment, in your system you may set it to higher value, but less than referenced pool size)
- Maximum Available Size = 25 (maximum number of AM instances after pool clean-up)
- Idle Instance Timeout = 300 (AM instance is considered inactive after 5 minutes of inactivity, this if for stress test. In your system you would set it something close to Web session timeout - to prevent frequent passivation/activation)
- Pool Pooling Interval  = 120 (AM pool is cleaned every 2 minutes)

1. Optimistic (15 concurrent users, 300 transactions in 10 minutes)

This test is performed on first ever access. As you can see, 22 AM instances are created, as per initial pool size setting. However, soon (idle time 5 mins + pool cleaning interval 2 mins) 7 AM instances are removed - because we have only 15 online users. Passivation/activation never happens (because referenced pool is set to be for 20, and we have only 15).  MainModule statistics:


Same for HrModule module:


Very important, because Minimum Available Size = 0, after idle time entire pool is cleaned:


Same with DB connections, there is no need to wait for AM time to live, AM instances and DB connections can be released earlier - however this will trigger passivation. DB connection can be released before AM time to live, by tuning AM pool Minimum Available Size and AM Instance Timeout:


2. Average (25 concurrent users, 5000 transactions in 10 minutes)

This test with 25 online users is slightly above Referenced Pool Size = 20. We should experience passivation/activation behavior.

AM pool allocates 20 active instances for 25 users (as per Referenced Pool Size). Passivation/activation starts to take place, in order to support all 25 users (around 500 passivation/activation circles per minute):


Similar behavior for the second AM:


40 DB connections are used during peak time, when both AM's are active (20 + 20 active AM instances):


As you can see, even Maximum Pool Size = 30, active instance size is not exceeding Referenced Pool Size.

3. Pessimistic (80 concurrent users, 16000 transactions in 10 minutes)

With 80 users, AM pool starts to passivate/activate much more (as expected). There are 20 active AM's,  as per Referenced Pool Size and those 20 AM's need to serve all 80 users. There are lots of switch activity happening - around 1500 passivation/activation circles in 1 minute:


Runtime statistics for the second AM:


During strong stress test, we can see that we were using at some moments more than 40 (20 per each AM) database connections (as previous test). Means AM pool during heavy stress test may maintain more active AM instances than specified by Referenced Pool Size - but still, AM size will not exceed Maximum Pool Size setting (30 in our case):


Conclusion: AM Pool is strong enough to handle stress peaks with online users greatly exceeding number of AM Pool Size and and AM Referenced Pool Size. However, in your system you should try to maintain AM Pool sizing as close as possible to expected number of online users - this will help to avoid performance costly passivation/activation operations.

Saturday, March 21, 2009

Extension for ADF Development Quality Testing in JDeveloper 11g

In my Oracle Fusion Middleware project we are using ADF BC, ADF Task Flows and ADF Faces Rich Client. Its a cool set of technologies that allows to speed up development process. Additionally, what is also very important, it allows to control quality of developed code in more easier ways comparing to plain J2EE development. Oracle ADF framework is based on XML definitions, this means we can validate generated/developed XML against agreed development standards.

We have found interesting way to control and keep project quality on high level - by implementing JDeveloper 11g extension for automatic development quality testing. Based on our development practice, we have selected most common quality violations comparing to defined project rules, and have implemented testing tool that can be plugged-in into JDeveloper 11g. What is important to mention, our tool is not static, we always can add new rules for quality tests when its needed.

In order to run quality test, its enough to select any project in JDeveloper 11g workspace and invoke developed extension:


Wizard will open and will ask what rule we want to check:


Let's select first one - 'Entity attribute label missing', where we can scan all Entities and check if localized labels are assigned for attributes. As result, report is generated where we can see attribute names per Entities without assigned labels:


PhoneNumber attribute is not included into report, and its correct, because this attribute have assigned label:


Another check we can do for ADF BC, is to verify Primary Keys on LOV View Objects. If for example, DepartmentsView LOV will not have Primary Key defined:


And we will run quality test for related rule:


Information about rule violation will be included into report:


We are doing automatic checks not only for ADF BC part, but for ADF Faces Rich Client and ADF Task Flows as well. For example, we can check if developer didn't forgot to put af:table into af:panelCollection. And if there will be violation:


We can invoke automatic test for this rule:


And get report for any violations:


Spanish Summary:

El control de calidad de las aplicaciones desarrolladas con ADF BC son faciles de realizar gracias al uso de archivos descriptores (XML) que el framework utiliza. En este post Andrejus muestra un plugged-in que ha desarrollado para validar el cumplimiento de algunas carateristicas que aseguren la calidad de los desarrollos con ADF BC.